-
 In this session we will explore complex cloud use cases you can manage within ApptioOne, including accruals, forecasting, multi-cloud chargeback, RI waste analysis, and reallocations. Additionally, we will discuss Cloud Business Management reporting and its role in driving accountability, optimizing cloud spend, and creating custom reports for various roles. Join us to learn how ApptioOne can empower you to navigate today's multi-cloud environments and enhance your cloud management strategy.
 -
 Many organizations have a goal to understand, track, and control the TCO of applications or services, but it can be challenging to accomplish. In this session, we'll discuss what makes TCO so important, important decisions you'll need to consider along the way, and some best practice guidance on reaching your TCO goal.
 -
 Apptio can be used for so much more than App TCO and Service Costing. Let's talk about valuable non-traditional use cases you might want to consider exploring.
 -
 Discover the growing trend of organizations adopting the FinOps methodology and its integration with the TBM framework. In this session, we'll explore how the TBM office and FinOps teams can collaborate effectively to achieve desired outcomes, fostering a synergistic relationship between them, and leveraging the combined capabilities of Apptio and Cloudability for optimal results.
 -
 This session offers practical solutions to financial challenges faced in enterprise agile environments. Participants will learn best practices for budgeting, forecasting, capitalization, and labor cost allocation, as well as both short-term tactical advice and longer-term strategic insights. The session covers topics such as participatory budgeting, flipping the iron triangle, and funding teams, products, and capabilities instead of projects.
 -
 Learn about the various techniques and emerging methods companies are taking to capitalize Agile work. You'll learn how some companies are moving away from timesheets and using models based on story points and team rates to generate capitalization reporting.
 -
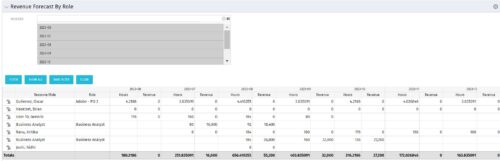 The Revenue Forecast by Role portlet displays forecasted revenue by both resource and role on the given project, broken out by month. The table below describes the available filter fields in the portlet.
Column Label Description Months Fiscal months to display -
 This portlet shows the project costs by Month. The information displayed includes:
- Start Date for project
- End Date for project
- Budgeted Cost
- Planned Cost
- Actual Hours
-
This portlet shows the project costs by Month. The information displayed includes:
- Start Date for project
- End Date for project
- Budgeted Cost
- Planned Cost
- Actual Hours
-
This portlet shows the project costs by Month. The information displayed includes:
- Start Date for project
- End Date for project
- Budgeted Cost
- Planned Cost
- Actual Hours
-
 Part of the Business Transformation collection, this pie chart portlet displays realized benefit, grouped by category for portfolio investments. It uses System Provider: Portfolio Investment Provider.
 -
Part of the Business Transformation collection, this pie chart portlet displays realized benefit, grouped by category for portfolio investments. It uses System Provider: Portfolio Investment Provider.


Copyright 2023 • Rego Consulting Corporation • Privacy Policy