
A process creating a new Cost Plan.
Cost Plan properties:
|
-
-
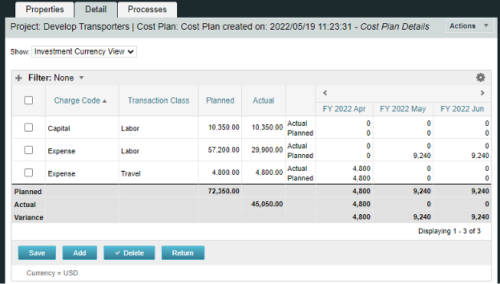
A process creating a new Cost Plan. Cost Plan properties:
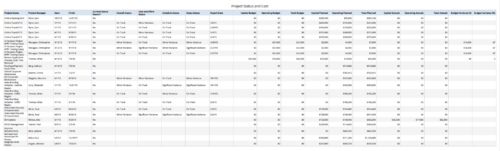
Pre-conditions:Name Cost Plan created on: yyyy/mm/dd hh:mm:ss Grouping attributes Charge Code, Transaction Type Start Period The earliest fiscal period with Actuals (from PPA_WIP table) or current period, if there are no actuals Finish Period The latest fiscal period with a non-zero allocation (from PRJ_BLB_SLICES table, SLICE_REQUEST_ID = 6 Period Type Monthly Plan of Record True Planned Cost For periods in the past – from Actuals (Charge Code, Transaction Type, Quantity (Units), Cost (Amount) taken from Transactions (PPA_WIP & PPA_WIP_DETAILS); For current and future periods – from Allocations (Charge Code taken from the Project, Transaction Class from the Resource, Quantity from allocation slices, Cost from the Rate Matrix (NBI_PROJ_RES_RATES_AND_COSTS table) - the Project must be financially enabled.
- if a new Team Member is added, Rate Matrix job must be run, so the rates are populated in the NBI table.
- if the Allocation changes, allow the timeslice job to finish before running the process.
- the Project should have the Charge Code set.
-
A process creating a new Cost Plan. Cost Plan properties:
Pre-conditions:Name Cost Plan created on: yyyy/mm/dd hh:mm:ss Grouping attributes Charge Code, Transaction Type Start Period The earliest fiscal period with Actuals (from PPA_WIP table) or current period, if there are no actuals Finish Period The latest fiscal period with a non-zero allocation (from PRJ_BLB_SLICES table, SLICE_REQUEST_ID = 6 Period Type Monthly Plan of Record True Planned Cost For periods in the past – from Actuals (Charge Code, Transaction Type, Quantity (Units), Cost (Amount) taken from Transactions (PPA_WIP & PPA_WIP_DETAILS); For current and future periods – from Allocations (Charge Code taken from the Project, Transaction Class from the Resource, Quantity from allocation slices, Cost from the Rate Matrix (NBI_PROJ_RES_RATES_AND_COSTS table) - the Project must be financially enabled.
- if a new Team Member is added, Rate Matrix job must be run, so the rates are populated in the NBI table.
- if the Allocation changes, allow the timeslice job to finish before running the process.
- the Project should have the Charge Code set.
-
 Course description: “How does my financial forecast and budget (project/program/portfolio) relate to the department/cost center budgets that finance prepares? Is there a better way to link the two together? This is a topic many organizations struggle with, and this session will review tools and processes that can help solve this problem.”
 -
 Benefits by year report provides the project manager a single place to view Benefit plan and its associated benefit for various years across multiple projects. Project Managers can use this report to analyze if the projects are giving intended benefits and take appropriate decisions accordingly. User can further narrow their search by OBS Type & Path, Investment Name, Investment Manager, Investment Type, Plan Type and Is Plan of Record?.
 -
 Project Cost within Budget report displays count of projects that are within or exceeding budget in the form of a bar chart. It also displays Total budget cost and Planned cost. User can further drill down the details to investment level. You can further narrow your search by OBS Type & Path and Investment Manager.
 -
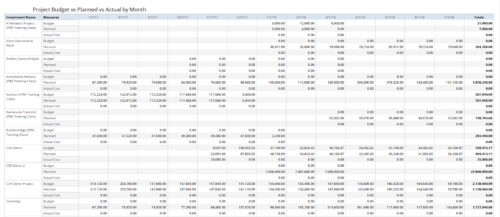
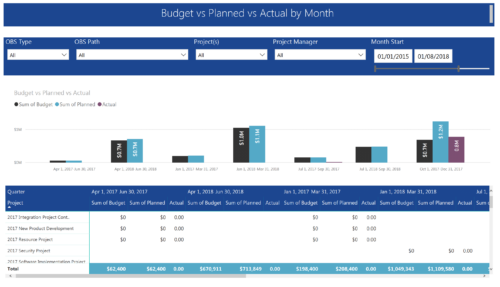 Project Budget vs Planned vs Actual by Month report provides the Project Managers a single place to view Project Budget, Planned and Actual Cost for multiple projects. This report displays Project Budget vs Planned vs Actual by Month in the form of clustered bar chart over a period of time. User can further drill down the information to investment level by selecting a particular bar within the chart. User can further narrow their search by OBS Type & Path, Project(s), Project Manager, Month Start and End Date.
 -
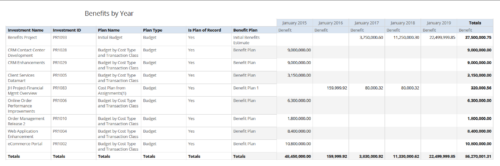
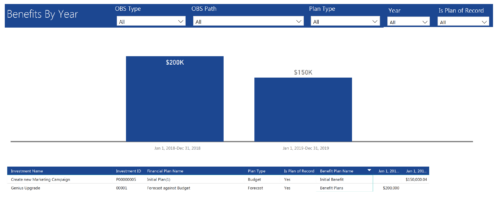 Benefits by year report provide the project manager a single place to view Benefit plan (Forecast /Budgeted) and its associated benefit for various years across multiple projects. Information is displayed in a bar graph and user can further drill down the details to investment level. Project Managers can use this report to analyze if the projects are giving intended benefits and take appropriate decisions accordingly. User can further narrow their search by OBS Type & Path, Plan Type (Budget/Forecast), Year and Is Plan of Record?.
 -
 Actuals & ETC by Resource Assignment report provides project managers a single place to view Actuals and ETC associated with resources across multiple Tasks and Projects. It displays the following: Actual and ETC Hours by Start Date: Stacked Column chart that displays the total Actual hours and ETC hours per month of fiscal period. Grey color indicates Actuals and Purple indicates ETC hours during that month. Grid: Displays Investment name, Task, Assigned resource ETC and Actual hours per month of fiscal period. It also displays aggregated column and row totals for Actuals and ETC hours. You can further narrow your search by OBS Type, OBS Path & Start Date range.
 -
 Many times Roles are spread out geographically or by function and these Roles will have different rates. For example, a developer in India may charge $25/hour vs a Developer in US may charge $50/hour. When the project team has a requirement of several developers, the PM will have to add a region specific role (Developer-US, Developer-India) so that the right rates can be applied when a cost plan is created. This creates a challenge in terms of Resource Management. As the Demand and Capacity can be spread between different region specific roles. Proper configuration on the Rate Matrix can allow you to have one Role name but different rates based on Location or Department. This allows greater flexibility and takes away the redundancy of Role Names. You can do so with the Project Team Member Properties.
 -

The Transaction Adapter – is a text based CSV file which automates the importing of monthly non labor financial data into Clarity directly from your financial system. This integration eliminates the need to create non-labor transactions manually in Clarity and will provide more accurate project, program, and portfolio financial reporting. -
 A quick reference card to assist in the creation of a Financial Summary for an investment.
 -
 Rego’s training materials on Clarity PPM Financials. This slide deck in based on the classic version of Clarity v15.4.1. Course materials start with an introduction, move to Cost Plans, Budget Plans and then finish with Reporting of Financial Data. There is also an appendix of supporting information.
 -
 Today, most high-performing organizations recognize that moving from project-funding to product-funding is necessary for achieving business agility. What doesn't exist in the industry is guidance on how to support the transition from a tooling perspective. In this session, Rego Expert Guide Robert Sirard presents a practical and tactical approach to using Clarity's PPM software and Rally's Agile software together to plan, track, monitor, and deliver products. At Rego, we realize that not everything needs to be done in an Agile manner, so Robert will discuss how this approach also supports a mix of traditional and Agile investments. ** No Download - Do not Add to Cart ** There is no download for this content. Follow the link to view - http://info.regoconsulting.com/product-funding-clarity-rally-may-2021
 -
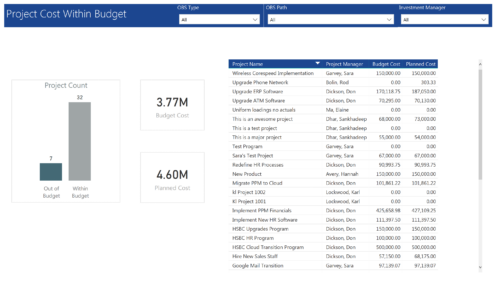
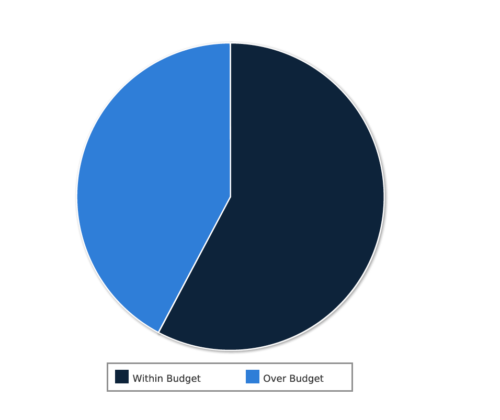 Project Cost within Budget report displays count of projects that are within or exceeding budget in the form of a pie chart. This report provides management a graphical representation of cost status on all projects. Mouse over on the pie chart displays count of projects for that category. You can further narrow your search by OBS Type & Path, Project Manager, Project Status, Project Stage, Program Name, Is project Active? And Is Template?.
 -
 Project Budget vs Planned vs Actual by Month report provides the Project Managers a single place to view Project Budget, Planned and Actual Cost for multiple projects. Project Managers can use this view to compare various costs for that project in a particular month. User can further narrow their search by OBS Type & Path, Is Project Active?, Fiscal Month Start Date, Investment Manager and Investment Name.
 -
 Project Status and Costs report gives the Project Manager a single place to view various Project Statuses ( Cost and Effort, Schedule, Scope and Overall ) and Costs ( Planned, Budget & Actuals ) for multiple projects. User can further narrow their search by OBS Type & Path, Project Name, Project Manager and Is Project Active?.
 -
 The Financial Summary by Transaction Class provides a visual graph for each year’s financial picture for multiple years. Report contains the following items: KPIs: Displays total benefit, capital, expense and net cash flow for the selected filter criteria Grid: Displays year wise break up of benefit, capital, expense and net cash flow for the selected filter criteria Graph: Benefit, capital, expense and net cash flow are depicted in graphical way for multiple years. This report will show the user where they need to concentrate their efforts in order to meet financial commitments. User can further narrow their search by OBS Type & Path.
 -
 A .pdf file that has the slide by slide presentation at 2015 RegoU on the elements of Financial Processing in CA PPM. The agenda covers a financial process overview, enabling time reporting, enabling financials, posting timesheets, transaction entries, posting to WIP, adjustments, importing financial actuals, and job scheduling.
 -
 Does project and idea estimation take too long and lack visibility? This class will address one of the most common pain points within organizations: how to involve the right people within a timely project estimate. Learn Rego’s model for defining, calculating, and modifying idea and project estimates, so you can increase throughput and ROI.
 -
 A presentation slide deck from Rego University 2022. This deck reviews Apptio’s self-service reporting tool. This tool is geared towards end users and empowers them to create and share their own reports.
 -
 A presentation slide deck from Rego University 2022. This class reviewed Apptio reporting options, tips & tricks, etc.
- Introduction
- Reporting Options for Apptio
- Reporting Tips & Tricks
- Reporting best practices
- Custom Report Showcase
-
 A presentation slide deck from Rego University 2022. An outline of topics used for a Apptio Round-Table discussion.
 -
 A presentation slide deck from Rego University 2022. This course reviews the new release features in ApptioOne.
- Where to find new releases
- Apptio BI
- ApptioOne
- Editable Tables
