
- Defining the Value of a Strategic Roadmap
- Roadmapping Methodology
- Best Practices
- TBM Roadmap Examples
-
 A presentation slide deck from Rego University 2022. This course reviewed the value of a strategic roadmap for TBM.
 -
 Are you considering the use of CA PPM's benefits tracking for planned and/or realized benefits? This session will be a review of common use cases for putting benefits forecasts and realized benefits into CA PPM along with the reporting available out of the box and within RegoXchange.
 -
 Uncover the advantages of shifting from showback to chargeback and learn how to successfully execute chargeback within your organization. In this session, we will delve into chargeback processes, focusing on industry best practices and offering expert guidance on designing and implementing effective chargeback strategies. Additionally, we will explore the utilization of the Bill of IT as a powerful tool to reinforce your chargeback approach.
 -
 A presentation slide deck from Rego University 2022. This class reviewed the importance of an application health check, optimization and tuning.
- Checking Apptio Version
- Tools Overview
- Configuration Tips
-
 Are you struggling with implementing Agile tools in your organization in addition to Clarity? This class will review best practices for implementing agile tools in conjunction with Clarity - living in a Bi-Modal world. We will discuss how Clarity can be used to govern both types of work and teams and how Agile tools should interface into Clarity.
 -
 Are you struggling with implementing Agile tools in your organization in addition to Clarity? This class will review best practices for implementing Agile tools in conjunction with Clarity - living in a Bi-Modal world. We will discuss how Clarity can be used to govern both types of work and teams and how Agile tools should interface into Clarity.
 -
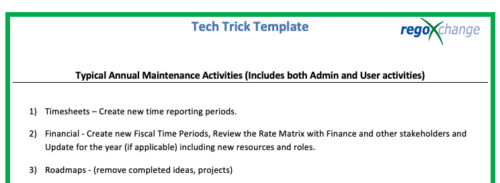 This is a list of 12 typical maintenance items that should be completed for Clarity on an annual basis. There is also a short list of items that should be completed periodically depending on client policies.
 -
 In this session we will explore complex cloud use cases you can manage within ApptioOne, including accruals, forecasting, multi-cloud chargeback, RI waste analysis, and reallocations. Additionally, we will discuss Cloud Business Management reporting and its role in driving accountability, optimizing cloud spend, and creating custom reports for various roles. Join us to learn how ApptioOne can empower you to navigate today's multi-cloud environments and enhance your cloud management strategy.
 -
 It is quite common for Rally and Jira to coexist. However, connecting them effectively enhances the value stream for development teams and product owners. Learn what is available to make this happen along with some typical design patterns.
 -
 This asset in used to update investment level TSV attributes using Cost Plan, Budget plan, Actual transaction, Planned and Budgeted Benefit Cost data as needed. It uses mappings/logic from ‘Cost Rollup Mappings’ object. Compatibility – Its compatible from 16.0 onwards with Oracle, PostgreSQL and MSSQL.
 -
 This workflow is run as a scheduled or immediate Job to populate Project Cost Plans. It can be configured to run on any desired set of projects. It can be configured to populate the Cost Plan of Record based on Allocations or based on Assignments.
 -
 This training document is a Rego Consulting Quick Reference Guide to assist with the creation of Cost Plans in Clarity’s Modern User Experience. The document reviews navigation to the Financial Module, the Cost Plan sub-page and creating the plan.
 -
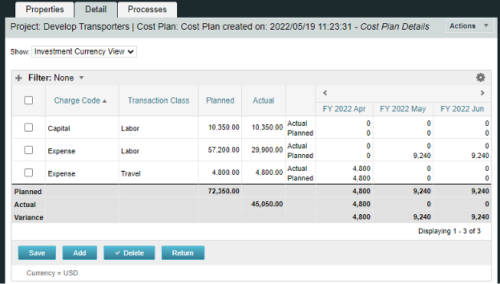
A process creating a new Cost Plan. Cost Plan properties:
Pre-conditions:Name Cost Plan created on: yyyy/mm/dd hh:mm:ss Grouping attributes Charge Code, Transaction Type Start Period The earliest fiscal period with Actuals (from PPA_WIP table) or current period, if there are no actuals Finish Period The latest fiscal period with a non-zero allocation (from PRJ_BLB_SLICES table, SLICE_REQUEST_ID = 6 Period Type Monthly Plan of Record True Planned Cost For periods in the past – from Actuals (Charge Code, Transaction Type, Quantity (Units), Cost (Amount) taken from Transactions (PPA_WIP & PPA_WIP_DETAILS); For current and future periods – from Allocations (Charge Code taken from the Project, Transaction Class from the Resource, Quantity from allocation slices, Cost from the Rate Matrix (NBI_PROJ_RES_RATES_AND_COSTS table) - the Project must be financially enabled.
- if a new Team Member is added, Rate Matrix job must be run, so the rates are populated in the NBI table.
- if the Allocation changes, allow the timeslice job to finish before running the process.
- the Project should have the Charge Code set.
-
 A Quick Reference Guide to assist in the creation of Benefit Plans in Clarity’s Classic UX. Reviews the process to access and create the benefit plan, entering benefit details lines, and associating a benefit plan to a cost plan.
 -
 A quick reference card to assist in the creation of a Financial Summary for an investment.
 -
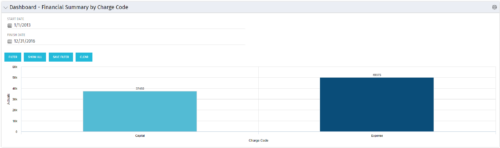 The Dashboard: Financial Summary by Charge Code portlet displays financial information from the project summarized by Charge Code. The portlet is added to the dashboard page of a project and will pull all actuals by charge code on the project. The user may filter by date range to narrow the results.
 -
The Dashboard: Financial Summary by Charge Code portlet displays financial information from the project summarized by Charge Code. The portlet is added to the dashboard page of a project and will pull all actuals by charge code on the project. The user may filter by date range to narrow the results.
-
 A presentation slide deck from Rego University 2022. A class on building a defensible cost model.
- Characteristics of a defensible model
- Steps to build an accurate TBM model
- Allocation best practices
-
 A Quick Reference Guide to assist in entering financial transactions into Clarity’s Classic UX. The guide reviews the basics of transactions entry, create voucher header, entering the line item - details, and entering the line item - transaction.
 -
 This training document is a Rego Consulting Quick Reference Guide to assist with transaction entry in Clarity’s Modern User Experience. The document covers transaction entry basics, creating a voucher header, entering line-item details, and entering line detail transactions.
 -
 Does project and idea estimation take too long and lack visibility? This class will address one of the most common pain points within organizations: how to involve the right people within a timely project estimate. Learn some Rego best practices for defining, calculating, and modifying idea and project estimates, so you can increase throughput and ROI.
 -
 This training document is a Rego Consulting Quick Reference Guide to assist with the process of creating financial actuals and the supporting reports in Clarity’s Modern User Experience. The document covers running jobs to sync data, analyzing cost plans, reviewing transactions, and analyzing cost and budget plans.
 -
 This configuration and accompanying process allows users to capture Financial and Non-Financial (Metrics, Soft, etc.) Benefit in a custom sub-object, then programmatically create an out-of-the-box Benefit Plan with just the Financial Portion from the custom sub-object. The solution is comprised of:
- Sub-Object (Benefit Plan Details, Parent = Project)
- Process: Create Benefit Plan (uses sub-object as primary input, native BP is output)
- Process: Update sql - Cost Benefit Plans (one-time script to update Projects)
- Ensure on the Benefit Details List view the Planned and Realized Amounts are displayed
- Modifying the Create Benefit Plan Process in support of a BP naming convention consistent with local PMO Practices
- Modifying the Create Benefit Plan Process to link the BP to the Cost Plan of Record
- Creating a Portlet that pulls together rows of data from the sub-object across multiple projects in a summarized view as well as a detailed view
-
This configuration and accompanying process allows users to capture Financial and Non-Financial (Metrics, Soft, etc.) Benefit in a custom sub-object, then programmatically create an out-of-the-box Benefit Plan with just the Financial Portion from the custom sub-object. The solution is comprised of:
- Sub-Object (Benefit Plan Details, Parent = Project)
- Process: Create Benefit Plan (uses sub-object as primary input, native BP is output)
- Process: Update sql - Cost Benefit Plans (one-time script to update Projects)
- Ensure on the Benefit Details List view the Planned and Realized Amounts are displayed
- Modifying the Create Benefit Plan Process in support of a BP naming convention consistent with local PMO Practices
- Modifying the Create Benefit Plan Process to link the BP to the Cost Plan of Record
- Creating a Portlet that pulls together rows of data from the sub-object across multiple projects in a summarized view as well as a detailed view
-
 This session offers practical solutions to financial challenges faced in enterprise agile environments. Participants will learn best practices for budgeting, forecasting, capitalization, and labor cost allocation, as well as both short-term tactical advice and longer-term strategic insights. The session covers topics such as participatory budgeting, flipping the iron triangle, and funding teams, products, and capabilities instead of projects.
 -
 The Financial Budget vs. Forecast by Period report provides insight into financial performance by comparing planned or budgeted costs against forecasted costs across defined time periods. It highlights period-level and total variances to help identify trends and deviations. Results can be grouped by up to two financial attributes, such as Charge Code, Cost Type, Department, Input Type, Location, Resource, Resource Class, Role, Transaction Class, or User Values 1 and 2, allowing flexible analysis by key dimensions.
 -
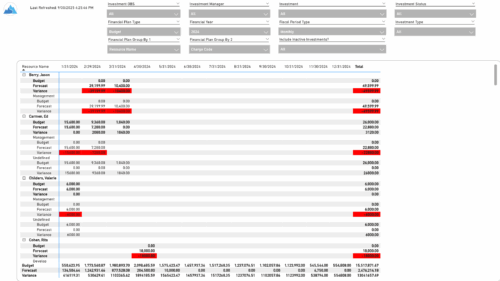
 The Financial Budget vs. Forecast by Period Detail report provides a detailed breakdown of planned or budgeted costs compared to forecasted costs by investment. It displays variances for each period and in total. Users can filter or drill down to view the specific investments that contribute to selected financial plan groupings.
 -
 Do you want to understand the OOTB configuration and functionality of financial management? In this class, we will review the OOTB objects, views, views, and functions of financial plans, rates, and other related areas. We will cover both classic and new UX highlighting differences.
 -
 Do you want to understand the OOTB configuration and functionality of financial management? In this class, we will review the OOTB objects, views, views, and functions of financial plans, rates, and other related areas. We will cover both classic and new UX highlighting differences.
 -
 Course Description: Do you want to talk to other customers that are using or plan to use financial management? In this moderated round table, customers can share experiences and provide insights on process, configurations, challenges, and successes. We will divide into small groups and discuss customer selected topics—100% sharing.
 -
 Do you want to talk to other customers that are using or plan to use financial management? In this moderated Round Table where customers can share experiences and provide insights on process, configurations, challenges, and successes. We will have an expert panel and then divide into small groups and discuss customer selected topics - 100% sharing.
 -
 Do you want to talk to other customers that are using - or plan to use - Clarity's financial management capabilities? In this moderated Round Table, attendees can share experiences and provide insights on process, configurations, challenges, and successes. We will have an expert panel and then divide into small groups to discuss customer selected topics. 100% sharing, 100% learning.
