-
 XOG & Query Bridge (XQ) is a 2-in-1 Clarity PPM toolset that provides enhanced functionality and an improved user experience when retrieving and inserting data to/from Clarity PPM environments. XQ is available as a Web-based application and also as a downloadable desktop version that supports both On-premise and On-demand Clarity PPM implementations. https://xogbridge.com/
 -
 The portlet is a browser XOG client in the form of an HTML portlet. The purpose is to read/write data from/to Clarity. To write the data, the user needs to have Project – Approve OR Project - Approve - All access right.
 -
 Course Description: Does your organization own Workfront in a marketing or other group doing digital asset management? In this session, we will dive into what Workfront is and how it complements your current Clarity PPM solution.
 -
 A Quick Reference Guide to create / manage Widgets. You can add to any Grid view that supports them. The five types are: Number Tile, Pie, Bar, Progress Ring, and Target.
 -
 Did you stray from OOTB? Was that the right decision? This session will be a discussion on pros and cons of sticking to Clarity’s stock attributes, views, and general capabilities. When does it make sense to avoid custom configuration? Conversely, when does it make sense to move beyond the standard OOTB setup?
 -
 Did you stray from OOTB? Was that the right decision? This will be a discussion on pros and cons of sticking to Clarity’s stock attributes, views, and general capabilities. When does it make sense to avoid custom configuration? Conversely, when does it make sense to move beyond the standard OOTB setup?
 -
 ** No Download - Do not Add to Cart ** As Clarity's Modern UX continues to evolve with each release, so has the transition conversation among Clarity Product Owners and Administrators. It's no longer a question of "if" and "when;" the question is, how? In this webinar, we'll explore some best practices that enable a successful shift from Classic to Modern. Through a collaborative discussion of overarching strategies to a step-by-step checklist, this session is designed to help you quickly position your users to take advantage of Clarity's latest and greatest capabilities. Nothing to Download - See Link below. http://info.regoconsulting.com/when-to-move-to-modernux-aug-2020
 -
 Rego’s slide deck on the new features added to Clarity with the release of version 15.9.3. Covers the new features: general and use-ability, project management, roadmap/hierarchy, and resource/staffing.
 -
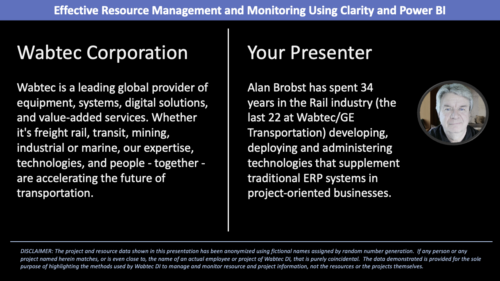 Wabtec shares how they utilized Clarity and Power BI to build an enhanced Resource Management monitoring solution.
 -
 Are you looking for some great examples of dashboards? We know you can’t get enough of them and neither can we! Come to this session to see a host of new reports that Rego has created! This session will review a host of pre-built dashboards in use today that can spark ideas for you to implement in your company. Learn about the Rego approach and method for how we prioritized which reports to create and how we gathered requirements from our Rego experts to target content you need!
 -
 A presentation slide deck from RegoU 2023. This course covered the various visualization tools available in Clarity and help you understand the best way to output your data.
 -
 Are you struggling to come up with a visualization strategy with all of the options available - widgets, portlets, Jaspersoft, Ad Hoc, etc.? This class will explore the various visualization tools available in Clarity and help you understand the best way to output your data. We will provide use cases and examples to assist you in developing a strategy for your organization.
 -
 Are you looking for some great examples of dashboards in Clarity? We know you can’t get enough of them and neither can we! Come to this session to see a host of new reports that Rego has created! This session will review a myriad of pre-built dashboards in use today that can spark ideas for you to implement in your organization. Learn about Rego's approach to prioritize and create reports, and how we gathered requirements from our Rego experts to target the content you need!
 -
 Are you struggling to come up with a visualization strategy with all of the options available - widgets, portlets, Jaspersoft, Ad Hoc, etc? This class will explore the various visualization tools available in Clarity and help you understand the best way to output your data. We will provide use cases and examples to assist you in developing a strategy for your organization.
 -

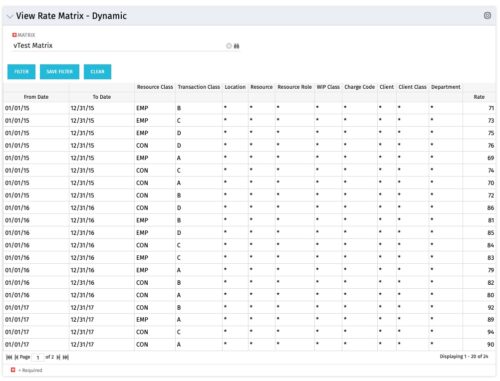 View Rate Matrix is a grid portlet that provides users a single place to view all the rates defined across multiple rate matrix without going to administration tab. Each Matrix may be defined with different columns (ex: Charge Code, Client, Department, Entity, Input type Code etc). This portlet dynamically brings only the columns associated with that rate matrix and provides the detailed information. User can view information related to one matrix at a time.
 -
View Rate Matrix is a grid portlet that provides users a single place to view all the rates defined across multiple rate matrix without going to administration tab. Each Matrix may be defined with different columns (ex: Charge Code, Client, Department, Entity, Input type Code etc). This portlet dynamically brings only the columns associated with that rate matrix and provides the detailed information. User can view information related to one matrix at a time.
-
 A presentation slide deck from Rego University 2022. Broadcom’s presentation on customer stories in the ValueOps arena.
- Introduction
- A note on Customer Case studies
- Transforming Customer
- Profile and Solution Use Case Objectives
- Solution Configuration Diagram
- Lessons Learned through adoption
- Q&A
- Kitchen Sink Customer
- Profile and Solution Use Case Objectives
- Solution Configuration Diagram
- Lessons Learned through adoption
- Q&A
-
 With ValueOps Insights you can gain transparency into full value stream analytics. Come learn about metrics to run your business including flow metrics, DORA, and value realization metrics that give your management team a compass to find the value your teams are delivering.
 -
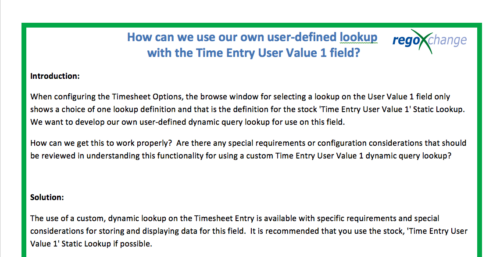 When configuring the Timesheet Options, the browse window for selecting a lookup on the User Value 1 field only shows a choice of one lookup definition and that is the definition for the stock 'Time Entry User Value 1' Static Lookup. We want to develop our own user-defined dynamic query lookup for use on this field. How can we get this to work properly? Are there any special requirements or configuration considerations that should be reviewed in understanding this functionality for using a custom Time Entry User Value 1 dynamic query lookup? The use of a custom, dynamic lookup on the Timesheet Entry is available with specific requirements and special considerations for storing and displaying data for this field. It is recommended that you use the stock, 'Time Entry User Value 1' Static Lookup if possible.
 -
 A Quick Reference Guide that provides an overview of the Common Grid components in Clarity PPM’s Modern UX. Looks at functionality of the Common Grid view, View Options, Adjusting Columns, Details Panel, and Group by Mode.
 -
 Learn how to use, and follow best practices with the Clarity REST APIs - Execute a REST Call - Create JSON payloads and parse JSON responses - Capture the result of the request
 -
 "Learn how to use, and follow best practices with the Clarity REST APIs
- Execute a REST Call
- Create JSON payloads and parse JSON responses
- Capture the result of the request"
-
 A tech trick document that assists you in update Data Source when utilizing the Power BI reports found in RegoXchange.
 -
 Struggling to use an external scheduler like MS Project or Smartsheet with Clarity or investigating its potential? Learn how to effectively use these tools with Clarity in this training, which includes best practices and lessons learned. We will show both OOTB and Rego build connectors that will make the bidirectional connections seamless.
 -
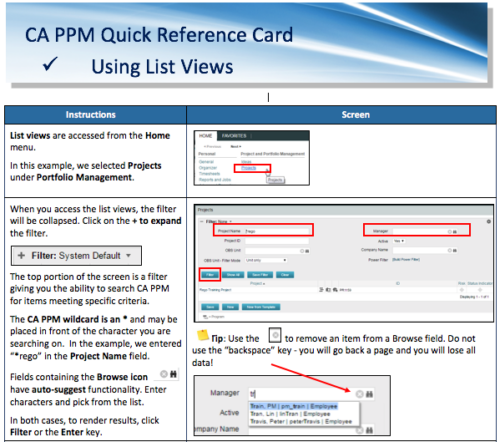 A Quick Reference Card to assist in the use of list views in CA PPM. List Views are accessed from the Home menu.
 -
 Course Description: Struggling to figure out how to best organize your blueprints? This class will walk through best practice blueprint design, including how many to have, how to use channels, using custom subobjects within the blueprint, and swapping blueprints at various project stages to mimic project phases or ideas. We’ll highlight some of the creative ways we’ve seen blueprints used in client implementations.
 -
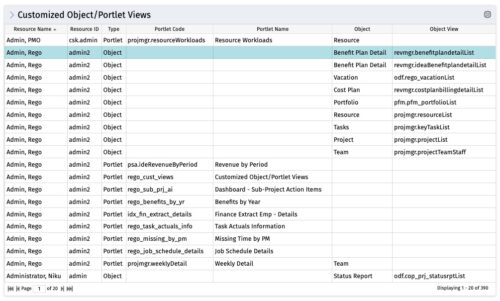 The Customized Object/Portlet Views portlet displays all user edited object/portlet views and the resource(s) that have edited them. This can assist in identifying users who need to be notified prior to publishing view changes. The table below describes the available columns on the object.
Column Label Description Resource Name Name of the resource Resource ID ID of the resource Type Object or Portlet Portlet Code ID of the portlet Portlet Name Name of the portlet Object Associated Object Object View ID of the modified view on the object Object Code Internal code used by the query pkid Internal code used by the query portlet_dbid Database id of the portlet res_dbid Database id of the resource -
The Customized Object/Portlet Views portlet displays all user edited object/portlet views and the resource(s) that have edited them. This can assist in identifying users who need to be notified prior to publishing view changes. The table below describes the available columns on the object.
Column Label Description Resource Name Name of the resource Resource ID ID of the resource Type Object or Portlet Portlet Code ID of the portlet Portlet Name Name of the portlet Object Associated Object Object View ID of the modified view on the object Object Code Internal code used by the query pkid Internal code used by the query portlet_dbid Database id of the portlet res_dbid Database id of the resource -
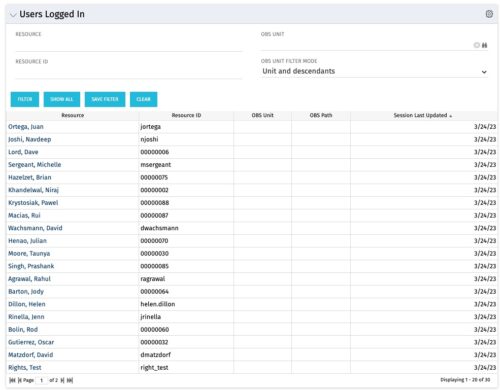 The Users Logged In portlet displays all users logged into the system. This portlet is helpful to determine the capacity during peak times, users still working before downtime, and the ability to view users logged in during the day. The portlet will display the resource, ID, OBS unit, OBS path, and when the user’s session was last updated.
 -
The Users Logged In portlet displays all users logged into the system. This portlet is helpful to determine the capacity during peak times, users still working before downtime, and the ability to view users logged in during the day. The portlet will display the resource, ID, OBS unit, OBS path, and when the user’s session was last updated.
-
The Users Logged In portlet displays all users logged into the system. This portlet is helpful to determine the capacity during peak times, users still working before downtime, and the ability to view users logged in during the day. The portlet will display the resource, ID, OBS unit, OBS path, and when the user’s session was last updated.


Copyright 2023 • Rego Consulting Corporation • Privacy Policy