
- Projects with 0 change requests
- Projects with 1 change request
- Projects with 2-5 change requests
- Projects with 5-10 change requests
- Projects with over 10 change requests
-
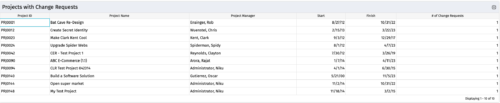
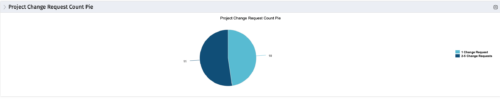 The portlet, Project Change Request Count Pie with drill-down is a simple pie that displays the total count of projects in the pie. The slices are:
 -
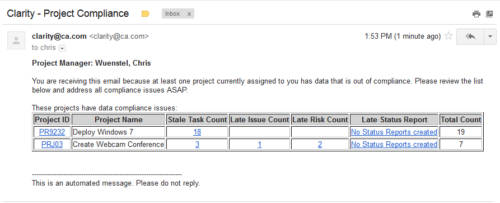 The Project Compliance Stalker – PM sends an email to Project Managers (and also their managers if so desired) at a set interval to alert them to project compliance issues. Areas of compliance that are reviewed include: stale project tasks (stale = past due date), late issues and risks (past due date) and late status reports.
 -
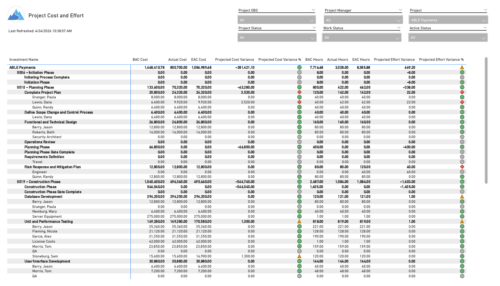 The Project Cost and Effort report provides a structured view of project financials and effort by outlining the work breakdown hierarchy, including any related subprojects. Users can choose to display information at varying levels of detail, such as project, phase, task, or assignment, depending on reporting needs. The report includes key metrics like baseline values, actuals, estimates at completion, and projected variances for both cost and effort. This enables stakeholders to analyze performance, monitor spending and workload, and gain insight into how projects are tracking against expectations.
 -
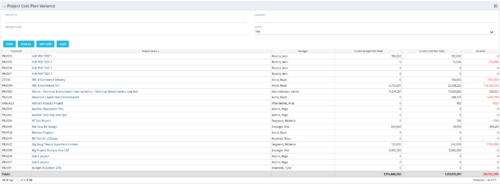 The Project Cost Plan Variance displays the variance between the budget and cost plans for projects the logged in user has security rights to view. The total for the Cost Plan that is marked as the Plan of Record for the project (Current Cost Plan Total), alongside the total for the current approved Budget Plan (Current Budget Plan Total). These two values are then compared in order to generate the total current Variance for the project. A positive amount in the Variance column indicates the project is under budget, while a negative amount indicates the project is over budget. Results may be filtered by: Project ID, Project Name, Manager, and whether the project is Active (Yes, No, All). By default, the portlet will display only Active projects.
 -
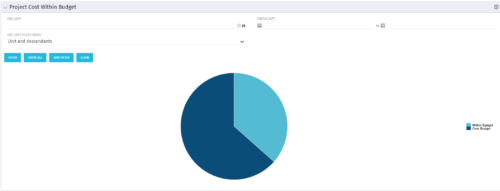 The Project Cost Within Budget portlet shows all projects that are within or exceeding their budgets in a pie chart. The user may filter by OBS and finish dates to narrow the projects. This portlet provides management with a graphical representation of the overall status of cost on all projects.
 -

 The portlet shows the project spend to vendors by month. The Vendor field picked on the portlet comes from the Vendor mentioned when creating the voucher (as displayed on the first screenshot). This provides a nice view of identifying how much is spent by an organization on the vendor employees on their workforce.
 -
 Part of the Business Transformation collection, this bar-chart portlet displays number of investments per stage. This provides a holistic overview of where the projects are within the organization.
 -
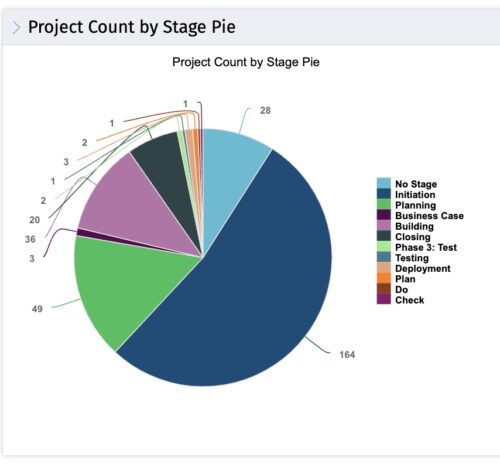
 This portlet displays the projects by Stage in a pie chart. Every piece of the pie chart represents a stage of the Project Management methodology applied. The portlet also shows the number of projects on each stage. The legend displays all the different project stages appearing on the portlet. This portlet can be filtered to show only projects from a particular OBS unit or for a particular Project Manager.
 -
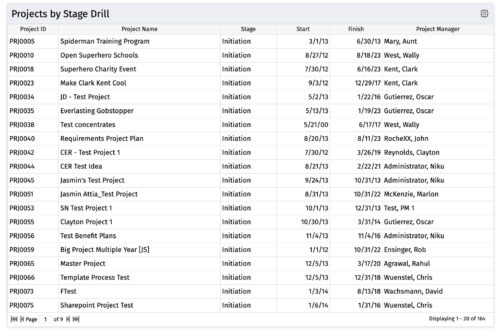
 The portlet, Count by Stage with Drilldown is a simple pie based on stage OOTB field. The drill down portlet has stage as a column. Clicking on any of the segments, e.g. Initiation, redirects to the Projects by Stage Drill portlet.
 -
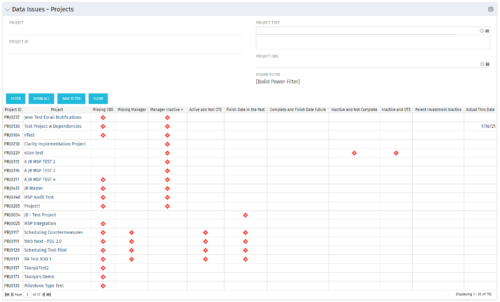 The Project Data Issues portlet is used to identify data exceptions related to project setup. This portlet helps to identify where projects are missing key data or are possibly sitting in an exception state. This view will show projects that have one or many exceptions, including inactive projects. The user may also narrow the results by project, OBS, or project type.
 -
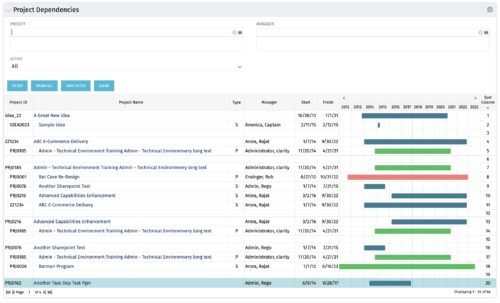
The Project Dependencies portlet displays all projects and their associated dependencies that the logged in user has rights to. This can assist in scheduling and visualizing the breakout of dependencies. The table below describes the available columns in the portlet. Column Label Description Project ID ID of the project Project Name Name of the project Type Relationship to above project, Parent Project (P) or Sub Project (S) Manager Manager of the project Start Start Date of the project Finish Finish Date of the project Gantt Visualization of project timelines Sort Column Used to order the columns for proper display of the portlet dimkey Internal code used by the query Inv_hlth_int Internal code used by the query Link_dbid Internal code used by the query link_toggle Internal code used by the query rel_active Internal code used by the query rel_dbid Internal code used by the query rel_mgr_dbid Internal code used by the query rel_sort Internal code used by the query -
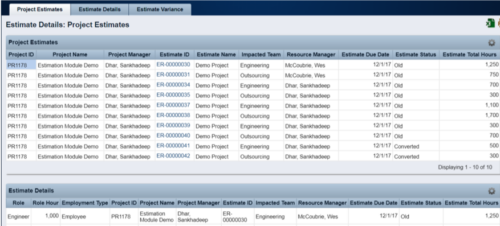 The Rego Estimation Module Provides a more accurate estimate earlier in the idea/project lifecycle.
- Is applied consistently so it can be improved.
- Retains the data in Clarity to enable analysis.
- Provides ongoing feedback by comparing estimates to current EAC.
- Provides historical record of estimating for projects overall as well as change requests.
