-
 The Grant RM Timesheet Edit Rights workflow process can be run through the "Execute a Process" job. The workflow will execute a query that gives a Resource Manager Timesheet Edit rights for their resources. Timesheet Edit rights are not inherent for Resource Managers when they are named as an individual’s resource manager.
 -
 The Grant Team Project Edit Rights workflow allows a project manager to grant Project – Edit Management rights to all users staffed on the project. This workflow saves not only the project manager time by allowing all users on the project to update information, but also saves the administrator time from granting each resource these rights individually. The process will also remove any rights from members that have been removed from the project.
 -
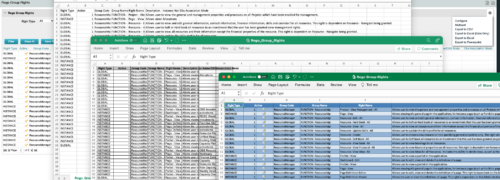
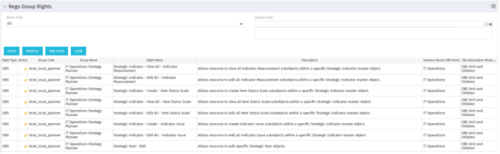 The Rego Group Rights portlet is a useful list view for functional administrators. It provides a flat view of all the Global, OBS and Instance rights that have been granted to all the groups in Clarity. It can be further filtered by just the rights type and/or the security group. It is also possible to export out to file in spreadsheet (csv, xlsx) or PowerPoint formats with OOB Clarity functionality.
 -
 The Hours and Cost by Vendor - Graph portlet displays vendor hour or costs by month. Using this portlet, management is provided with a graphical representation of vendor costs or hours by month for a set of time without running a report or navigating to each resource individually. This portlet uses the monthly actual timeslices. Additionally, the user must select a date range and whether to display hours or costs. Once populated, the graph will display all vendors that currently have hours and cost for the selected date range.
 -
 The Hours and Cost by Vendor – Grid portlet displays vendor hour or costs by month grouped by vendor. Using this portlet, management is provided with a quick overview of vendor costs or hours by month for a set of time without running a report or navigating to each resource individually. This portlet uses the monthly actual timeslices. The user may filter by vendor, vendor ID, date, and hours/cost in addition to the start/finish and hours/cost. Once populated, the grid will display all vendors that currently have hours/cost for the selected time frame.
 -
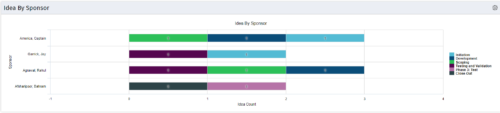 This portlet uses a bar graph to show the count of ideas by stage - grouped by the sponsor OBS. The X-axis displays the count and the Y-axis denotes the sponsor.
 -
 Part of the Business Transformation collection, this grid portlet displays idea details for all ideas (active and inactive) and all status conditions. This is an editable portlet based on the Ideas data provider. Filterable by OBS structure, Active/Inactive, and Status.
 -
 Part of the Business Transformation Content collection, this bar chart portlet displays count of ideas per business unit. This provides a holistic view of the idea pipe-line in an organization providing them a high-level of ideas converted, approved, unapproved per business unit.
 -
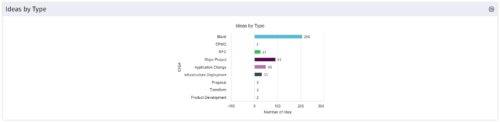 This is a great way to review demand by type and evaluate where demand is coming from and who will be impacted. Displays a bar graph of all ideas group by type.
 -
 Pie Chart displays count of all Ideas by Department. Filterable by Active and Inactive, by OBS, and by Department Manager. Data label and mouse-over show department counts. Legend displays department names.
 -
 Pie Chart displays total Ideas by Priority, filterable by Active / Inactive and by OBS structure. Data Label and Mouse-over label display counts by Priority. Legend shows Priority Name. Chart also shows Ideas with No Priority.
 -
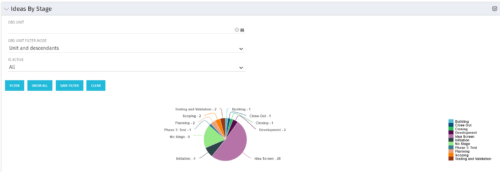 Pie Chart displays count of all Ideas by stage. Filterable by Active and Inactive, and also by OBS. Data label and mouse-over show Stage counts. Legend displays Stage names. This portlet assumes the use of the custom Stage attribute on Idea object.


Copyright 2023 • Rego Consulting Corporation • Privacy Policy