-
 With its end-to-end capabilities and aggregated data, ValueOps is an ideal platform on which to build the ultimate AI for value stream management. In this must-see session, Jean-Louis Vignaud, Head of ValueOps, will outline his vision of how our next generation of AI features will help deliver curated visibility, guided alignment, and augmented efficiency to the enterprise.
 -
 Join this session to learn best practices of when to use what module in Clarity (roadmaps vs hierarchies, CITs vs Projects...). Let’s really look at the power and adaptability of Modern UX features, through the lens of finding the best fit to meet the needs of your end users and business processes.
 -
 Join this session for best practices in optimizing Clarity's Modern UX modules. Learn how - and when - to use specific modules in Clarity (roadmaps vs hierarchies, CITs vs Projects, etc.). Let’s really dive into the power and adaptability of Modern UX features, through the lens of finding the best fit to meet the needs of your end users and business processes.
 -
 How do you address ever-growing backlogs and impatient demands from internal or external customers, while also balancing the desire to innovate with the need to maintain high performance and quality? This session focuses on proven techniques - learned over several years and iterations - to help win the battle against these challenges.
 -
 Most organizations struggle with collaborating across frameworks. Those managing FinOps activities, the TBM office, and Agile delivery teams are operating in silos, but there is a better way forward. In this class we’ll go through some strategies of bringing teams together to improve business outcomes through collaboration.
 -
 A presentation slide deck from Rego University 2022. A class about the goal of TCO and what it takes to achieve it.
- TCO Benefits
- Best Practices
- Deployment Tips
-
 ** No Download - Do not Add to Cart ** One thing that impacts a successful project outcome more than anything else is the people resourced to do the work. Yet Resource Management is often the last part of Clarity PPM to be used because users can view it as complicated and intimidating. It doesn’t need to be. In this webinar, Rego’s expert guide Michelle Merriam-Day will walk you through the three key components to successfully using Resource Management in your organization: - Quantify your capacity - Establish investment-level demand - Leverage foundational view for analysis. There is no download for this content. Follow the link to view - http://info.regoconsulting.com/3-steps-basic-resource-management-april-2021
 -
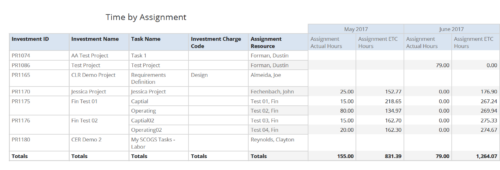 Time by Assignment report displays time logged to assignments and its associated actuals on monthly basis for all filtered investments. It also displays total ETC and Actual hours associated with an assignment. User can further narrow their search by OBS Type & Path, Investment Type, Investment Charge Code, Investment Name, Task Name, Resource Name, Assignment Start Date and Assignment Finish Date. User can use exact dates or relative dates for Assignment Start and Finish Dates filter parameters.
 -
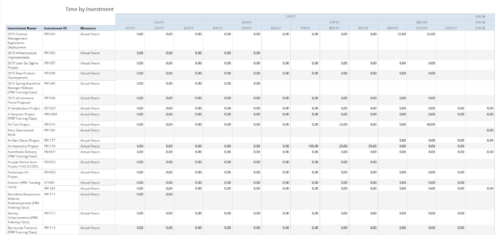 Time by Investment report displays time spent by resources on investment(s). User can view only the investments that he has access to view. Information can be drilled to Yearly, Quarterly or Monthly level. User can further narrow their search by OBS Type & Path, Investment Name, Month Start Date and Is Project Active?.
 -
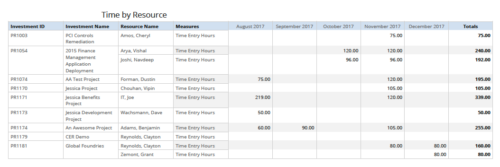 Time by resource is a grid report that provides resource and project managers a single place to view time logged to projects by resource over a period of time. This report provides information such as Investment ID, Investment Name, Resource Name and Time Logged Hours on period basis. Report provides you the flexibility of changing period type to Year, Quarter, Month and Day. You can further narrow your search by OBS Type & Path, Resource Name, Investment Name, Period Start Date and Is Investment Active?
 -
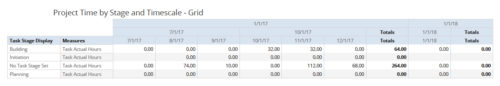 Time by Stage and Timescale – Grid report displays hours for all tasks on projects by their stage for a user-defined time period. Information can be drilled down to Year, Quarter or Monthly level. Using this report, Management can determine if excess time is being spent on a certain task stage within a project You can further narrow your search by Month Start Date, OBS Type & Path, Is Project Active? And Is Template?
 -
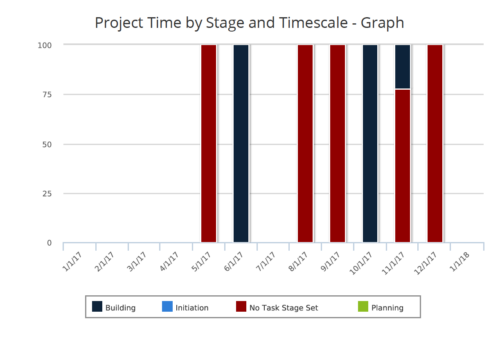 Time by Stage and Timescale – Graph report is a stacked column chart that displays hours for all tasks on projects by their stage for a user-defined time period. Using this report, Management can determine if excess time is being spent on a certain task stage within a project You can further narrow your search by Month Start Date, OBS Type & Path, Is Project Active? And Is Template?


Copyright 2023 • Rego Consulting Corporation • Privacy Policy