-
 The Resource Data Issues portlet is used to identify data exceptions related to resource setup. This portlet helps to identify where resources are missing key data or are possibly sitting in an exception state. This view will show resources that have one or many exceptions, including inactive resources. There is no security built into this portlet - all resources will show. The only required field in the filter is Days, which is the number of days since the user last logged in. The user may also narrow the results by resource, OBS, or project type.
 -
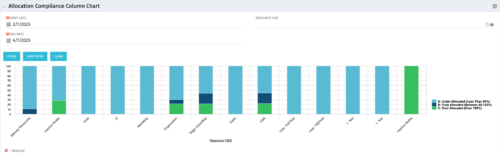 This view depicts Allocation Compliance for resources grouped by OBS. Using the daily Resource Availability and Daily Resource Allocation Time Slices this column chart groups aggregate Allocation vs Availability by OBS Unit. The chart allows quick analysis to see if resources are adequately allocated (between 80% to 120% of their capacity) or if they are significantly under or over allocated. NOTE: The grouping of OBS unit is limited to 1 level below the selected OBS in the portlet filter.
 -
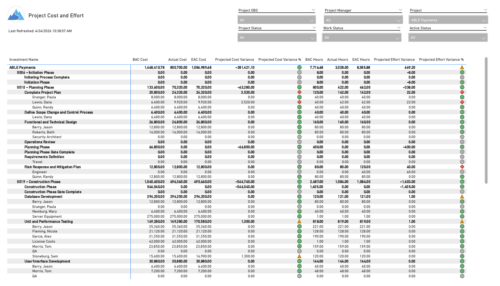 The Project Cost and Effort report provides a structured view of project financials and effort by outlining the work breakdown hierarchy, including any related subprojects. Users can choose to display information at varying levels of detail, such as project, phase, task, or assignment, depending on reporting needs. The report includes key metrics like baseline values, actuals, estimates at completion, and projected variances for both cost and effort. This enables stakeholders to analyze performance, monitor spending and workload, and gain insight into how projects are tracking against expectations.
 -
 The Investment Issue Register report displays comprehensive information for each investment issue. The report only includes investments where the Risk, Issues, and Change modules are available. Report Prerequisites Verify that you have completed the following prerequisites before you run this report: • The investment must have at least one issue for the project to display in the report. • The issue properties must have fields such as description, category, resolution, target resolution, impact date, and originating ID completed for them to display data in the report. The issue name, issue ID, priority, status, and owner are required in Classic PPM so they always display data. • The Load Data Warehouse job must be run before you run this report. If the Data Warehouse is not populated, the report will not display any data. Also, most of the report parameters do not display options.
 -
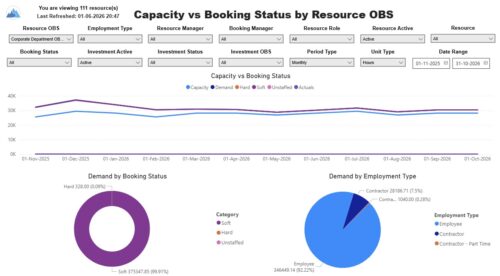 The Capacity vs. Booking Status by OBS report includes three charts. The line chart displays capacity compared to demand, with demand distributed by booking status, and actuals by period. The pie charts display demand by booking status and demand by employment type. The report also includes a detail listing of resource capacity and demand at the booking status level across investments. The report can be grouped by any OBS level, providing visibility into resources at any level of the organization. The report displays amounts by week or month, and in total. The amounts can be displayed as hours or FTEs. Report Prerequisites Verify that you have completed the following prerequisites before you run this report: • Resource capacity amounts display if the resource has availability that is defined and meets the parameter criteria. • Resource demand allocation amounts display if the resource is allocated to at least one investment. Resource assignments are not required. • The Load Data Warehouse job must be run before you run this report. If the Data Warehouse is not populated, the report will not display any data. Also, most of the report parameters do not display options.
 -

 “Rego Health Check” is a UI Friendly, Clarity Studio created add-in that allows environment administrators to create configurations which can be executed on a recurring basis to ensure the environment is running optimally. It allows the Clarity admin to run an Infrastructure Health Check and Status Summary, Application Health Check, and Business-related Checks. This is a RegoLink product that is available for purchase. The download materials provide more information on this product. Contact your Rego Account Director for more information.
 -
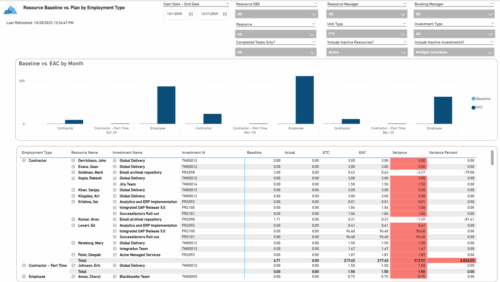 The Resource Baseline vs. Plan by Employment Type report provides insight into how resource utilization compares to the original baseline. It displays baseline, actual, estimate, and variance values for each resource across investments, grouped by employment type—such as employees or contractors. The report includes monthly charts that compare baseline amounts to estimated-at-completion values, with data shown in either hours or full-time equivalents (FTEs). This enables clear visibility into performance and variances by employment category.
 -
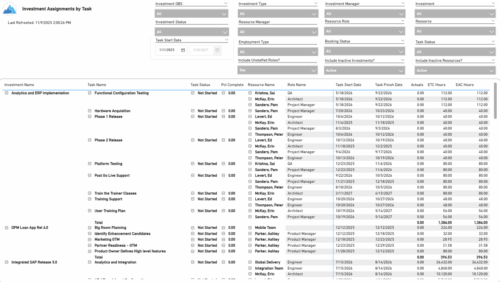 The Investment Assignments by Task report provides a detailed breakdown of effort at the task-assignment level for each investment. It displays both actuals and estimates for resource assignments, along with task status, percent complete, and assignment start and finish dates. Totals are available at the investment level, making it easy to analyze workload, progress, and effort distribution across tasks and resources.
 -
 Join us to discuss one of the most important - but also one of the most confusing Clarity topics - security. Learn how an OBS can be utilized to control security, how security permissions can be granted and revoked, and the pros and cons of the different types of security permissions.
 -
 Utilize Power BI with the Clarity ODATA connector to get critical data for rich reports and dashboards. This class is a hands-on beginner training for Power BI. learn how to build basic visuals and reports against the Clarity data warehouse.
 -
 Did you stray from OOTB? Was that the right decision? This session will be a discussion on pros and cons of sticking to Clarity’s stock attributes, views, and general capabilities. When does it make sense to avoid custom configuration? Conversely, when does it make sense to move beyond the standard OOTB setup?
 -
 Change is constant in an organization, and each change is more than just a one-time event. This session will talk about keys to successfully sustaining change adoption vs. just implementing change in your organization.


Copyright 2023 • Rego Consulting Corporation • Privacy Policy