-
 A Quick Reference Guide that covers how to staff a Team in Clarity’s Modern UX. It reviewes some of the key terminology, covers Allocation vs. ETC, accessing the Staffing Tab, and viewing time-scaled allocations.
 -
 A Quick Reference Guide to assist in the population of the Project Property Details. Reviews accessing and updating the project property details. Also shows alternative in-line edits.
 -
 A slide deck used in Rego’s training classed for Project Management in the Modern User Experience. Reviews terms and definitions, the OBS, Work Breakdown Structure, Templates, Roles and Responsibilities, Allocation vs ETC, Accessing Projects, Project Creation, Staffing, Tasks, Assignments, To Dos, Project Financials, and more.
 -
 A Quick Reference Guide to assist in the staffing of an Idea in Clarity’s Classic UX.
 -
 A slide deck that reviews the processes for time entry and approval of timesheets in Clarity’s Modern UX. Used for Rego’s training engagements, it covers the Time Entry process via flow chart, steps for submitting a timesheet, adjusting a returned timesheet, and adding or removing tasks from a timesheet.
 -
 A Quick Reference Guide that provides an overview of the Common Grid components in Clarity PPM’s Modern UX. Looks at functionality of the Common Grid view, View Options, Adjusting Columns, Details Panel, and Group by Mode.
 -
 A Quick Reference Guide that reviews access to Project Tasks and Task To Dos in Clarity PPM’s Modern UX.
 -
 A Quick Reference Guide to assist with General Navigation of Clarty, using the Classic UX with the Phoenix UI Theme. Reviews the Main Menu Bar, User Tool Bar, Home Menu, Favorites Menu, and more.
 -
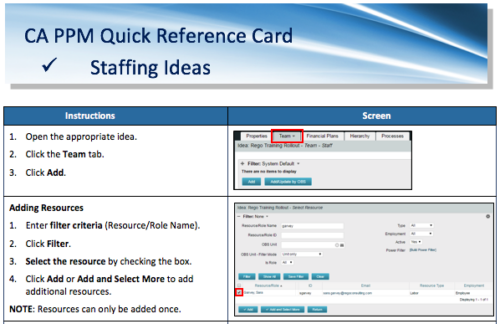 A Quick Reference Card to assist in adding resources and roles to Ideas in the Classic UX. Updating Allocation is also covered.
 -
 Learn how to create Custom Domains and Dashboards on the fly with Rego's Atul Kunkulol. This is a fun technique to use with your Demand and Capacity. Download is the slide deck file. To view the webinar click here - http://event.on24.com/wcc/r/1219157/B398371FAAAF960D6B26717D66F8011A
 -
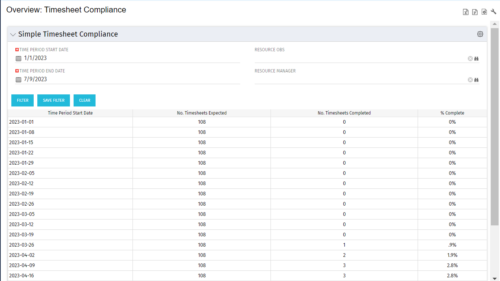 This portlet provides a view into the number of timesheets that were expected to be completed for a specified time period(s) as well as the number of timesheets that were completed and the percent complete. This can also be filtered by OBS so that a company can see timesheet compliance at the OBS level.
 -
This portlet provides a view into the number of timesheets that were expected to be completed for a specified time period(s) as well as the number of timesheets that were completed and the percent complete. This can also be filtered by OBS so that a company can see timesheet compliance at the OBS level.


Copyright 2023 • Rego Consulting Corporation • Privacy Policy