-
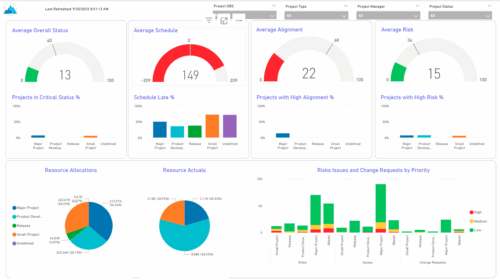 The KPIs by Project Type (Dashboard) report provides visibility into key project health measures, including status, schedule, alignment, and risk. Gauge visuals highlight each KPI at a summary level, while column charts break down results by project type. Resource allocation and actual hours are summarized in pie charts, making it easy to compare utilization across project types. In addition, bar charts display the number of issues, risks, and change requests by project type and priority, helping teams quickly identify areas of concern.
 -
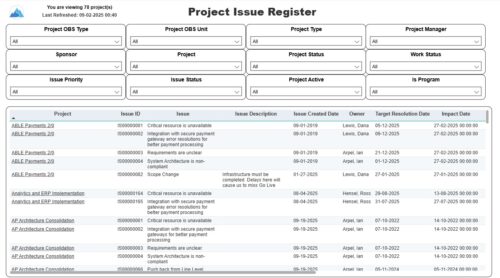 The Project Issue Register report displays comprehensive information for each project issue. The issue register also provides the option to display items that are associated to the issue such as notes, action items, and tasks. Report Prerequisites Verify that you have completed the following prerequisites before you run this report: • The project must have at least one issue for the project to display in the report. • The issue properties must have fields such as description, category, resolution, target resolution, impact date, and originating ID completed for them to display data in the report. The issue name, issue ID, priority, status, and owner are required in Classic PPM so they always display data.
 -
 The Project Status Detail report provides a comprehensive view of each project’s key elements, including team allocations, major milestones, risks, issues, and change requests. It highlights the most relevant project indicators to give stakeholders a clear understanding of project health and progress. This report supports detailed tracking and review of project performance across multiple dimensions.
 -
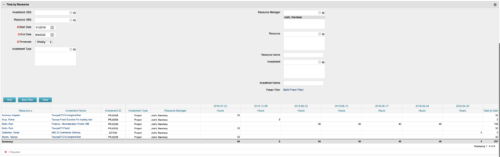
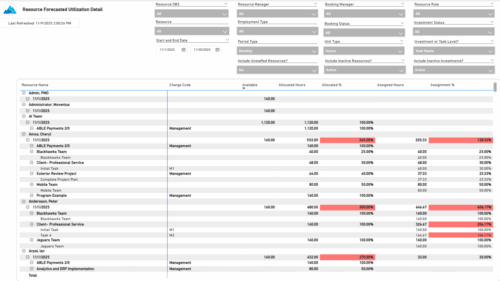 The Resource Forecasted Utilization Detail report provides a detailed view of resource utilization by showing availability, allocation, and assignment values at both the investment and task level. The report is grouped by resource and time period, with data displayed weekly or monthly, as well as in total. Values can be shown in hours or full-time equivalents (FTEs), supporting detailed analysis of workload and forecasted demand.
 -
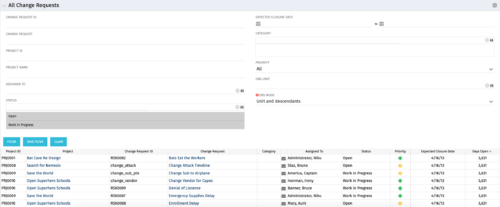 The All Change Request portlet displays all change requests related to active projects that the logged in user has view rights to. The portlet provides the project manager a single place to view change requests across multiple projects without having to go into each project individually and allows for more efficient management and reporting across projects. The filter allows the user to narrow their search by date ranges, resources involved, and/or the project with which the Change Request is associated. Other alternatives for filtering include the category, priority or status of the Change Request. In the list view, a status is displayed for each Change Request (CR), along with the Project with which the CR is associated, the CR ID, the CR name, the resource to whom the CR is assigned, Priority, Expected Closure Date, and number of days the CR has remained open. Note: Only the projects that the user has viewer rights to will show up in the list.
 -
 The All Issues portlet displays all Issues related to active projects that the logged in user has view rights to. The portlet provides the project manager a single place to view issues across multiple projects without having to go into each project individually, and allows for more efficient management and reporting across projects. The filter then allows the user to narrow their search by Issue ID, Issue Name, Project ID, Project Name, the individual to whom the issue is assigned, and Issue Status. You may also narrow the view to display issues with a target resolution date within a certain date range, or Issues associated with a particular Category or OBS unit. Note: Only the projects that the user has viewer rights to will show up in the list.
 -
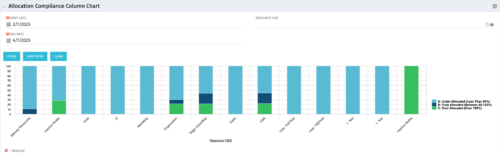 This view depicts Allocation Compliance for resources grouped by OBS. Using the daily Resource Availability and Daily Resource Allocation Time Slices this column chart groups aggregate Allocation vs Availability by OBS Unit. The chart allows quick analysis to see if resources are adequately allocated (between 80% to 120% of their capacity) or if they are significantly under or over allocated. NOTE: The grouping of OBS unit is limited to 1 level below the selected OBS in the portlet filter.
 -
 The Executive Dashboard portlet displays information regarding projects the user has security rights to view. It provides a one-stop place for the PMO or management to view all critical information about projects. The portlet not only displays status indicators as well as dates for late items, variances and days late, but also displays the project status fields from the Status Report sub-object.
 -
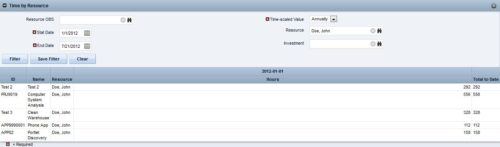
 This portlet displays the actual hours resources entered against investments. The per-period actual hours can be showed in days, weeks, months, quarters, or years. The data can be filtered by Resource, Resource Manager, OBS Unit, Investment and time period
 -
 A presentation slide deck from Rego University 2022. The course discusses factors that differentiate Requirements.
- Introduction (What & Why)
- Definition & Uses of Requirements
- The Challenges in Requirements in Software
- Revisit the Agile Taxonomy
- The Transition from Traditional to Agile
- Rethink the Agile Portfolio
- Guidelines and Characteristic of Taxonomy
-
 A presentation slide deck from Rego University 2022. This document outlines the advantages of using the Rego Data Processor and Data Extractors for integrations with other software tools. • Introduction • Understanding Clarity and its Architecture • Why use Integrations • Wheel and Spoke • Outbound Integrations • Inbound Integrations • Rego’s Approach • Rego’s Data Processor • Rego’s Data Extractor • Recommendations
 -
 This training document is a Rego Consulting Quick Reference Guide to assist with the utilization of Tasks and To Do’s in Clarity’s Modern User Experience. This doc references version 16.1 views. Document references the Tasks and To Do’s menu items and their associated widgets.


Copyright 2023 • Rego Consulting Corporation • Privacy Policy