-
 Prosci presents an AI Adoption Workshop with a focus on getting a ROI on your investment in AI.
 -
 Prosci presents concepts on changing Portfolio Management. They share their approach on the people side of PfM, with a goal of addressing the saturation and collision of multiple projects, initiatives or work efforts.
 -
 Discover Rego's integration tools that are specifically built to help develop and standardize the integration process. Learn about Rego's Data Extractor - a highly configurable and efficient tool to extract Clarity data into flat files. And also Rego's Data Processor - a highly configurable tool that abstracts the most common development tasks for an inbound integration. We'll review both tools and discuss integration best practices.
 -
 The Project Status Detail report provides a comprehensive view of each project’s key elements, including team allocations, major milestones, risks, issues, and change requests. It highlights the most relevant project indicators to give stakeholders a clear understanding of project health and progress. This report supports detailed tracking and review of project performance across multiple dimensions.
 -
 The Time Compliance Detail report displays the timesheet status by resource, their email, employment type, and resource manager, in their respective OBS.
 -
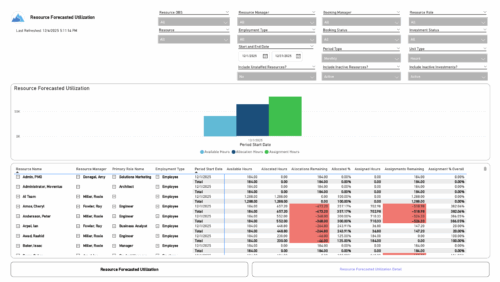 The Resource Forecasted Utilization report provides a high-level view of resource workload by displaying availability, allocation, and assignment amounts over time. Data can be viewed weekly, monthly, or in total, helping teams understand capacity and forecasted demand. Values are shown in either hours or full-time equivalents (FTEs), making it easy to compare utilization across resources and time periods.
 -

 The Capacity Graph portlet displays Availability, Allocations, Actuals and Assignments for one or more active resource(s) in a single view. This portlet pulls data from timeslices, and allows the user to filter on a weekly, monthly or quarterly data. The Estimated Time to Complete (ETC) and Allocation data will only show for projects that are active. This portlet provides Resource Managers, PMOs and Executives with a simple way to analyse: Allocations vs. Availability, Allocations vs. Actuals, Allocations vs. ETC and ETC vs. Availability. The graph allows the user to determine where areas of improvement may exist and quickly identify potential areas of constraint. Note: the information displayed is dependent on what the user has security rights to view.
 -
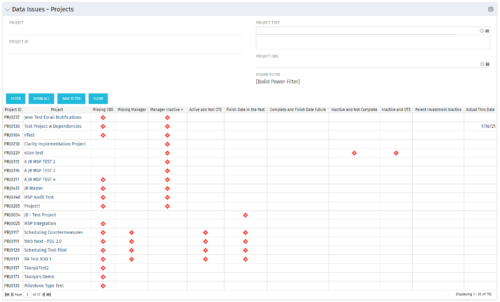 The Project Data Issues portlet is used to identify data exceptions related to project setup. This portlet helps to identify where projects are missing key data or are possibly sitting in an exception state. This view will show projects that have one or many exceptions, including inactive projects. The user may also narrow the results by project, OBS, or project type.
 -
 The Resource Data Issues portlet is used to identify data exceptions related to resource setup. This portlet helps to identify where resources are missing key data or are possibly sitting in an exception state. This view will show resources that have one or many exceptions, including inactive resources. There is no security built into this portlet - all resources will show. The only required field in the filter is Days, which is the number of days since the user last logged in. The user may also narrow the results by resource, OBS, or project type.
 -
 The Executive Dashboard portlet displays information regarding projects the user has security rights to view. It provides a one-stop place for the PMO or management to view all critical information about projects. The portlet not only displays status indicators as well as dates for late items, variances and days late, but also displays the project status fields from the Status Report sub-object.
 -
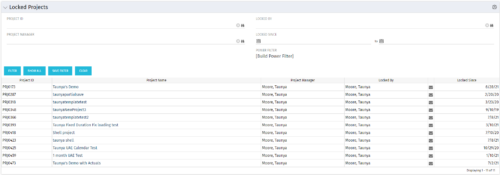 The Locked Projects portlet displays all of the projects in the system that are currently in a ‘locked’ state. The user may view the project ID, Project Name, Project Manager, the user who locked the project, the user's email address, and the date the project was locked. Administrators may utilize the data in this portlet in order to determine if a manual unlock should be executed on a project that has been locked for an extended period of time. Extended locks may indicate the individual has forgotten that he or she had obtained the lock. The portlet includes a hyperlink on the Project Name field, which will allow the administrator to more easily access and unlock the project as well as an email link to mail the user who locked the project.
 -
 A presentation slide deck from Rego University 2022. This document reviews the discussion around AI and the more realistic option of Predictive Modeling that exists in the near future of PPM. Then the group worked on ideas to bring to PPM tools via PM.
- Predictive Modeling / AI Trend
- Why are we here? Goals for this session
- Creativity Workshop - Brainstorming
- Summary of Themes
- Qualify top Themes


Copyright 2023 • Rego Consulting Corporation • Privacy Policy