-

 The Capacity Graph portlet displays Availability, Allocations, Actuals and Assignments for one or more active resource(s) in a single view. This portlet pulls data from timeslices, and allows the user to filter on a weekly, monthly or quarterly data. The Estimated Time to Complete (ETC) and Allocation data will only show for projects that are active. This portlet provides Resource Managers, PMOs and Executives with a simple way to analyse: Allocations vs. Availability, Allocations vs. Actuals, Allocations vs. ETC and ETC vs. Availability. The graph allows the user to determine where areas of improvement may exist and quickly identify potential areas of constraint. Note: the information displayed is dependent on what the user has security rights to view.
 -
The Capacity Graph portlet displays Availability, Allocations, Actuals and Assignments for one or more active resource(s) in a single view. This portlet pulls data from timeslices, and allows the user to filter on a weekly, monthly or quarterly data. The Estimated Time to Complete (ETC) and Allocation data will only show for projects that are active. This portlet provides Resource Managers, PMOs and Executives with a simple way to analyse: Allocations vs. Availability, Allocations vs. Actuals, Allocations vs. ETC and ETC vs. Availability. The graph allows the user to determine where areas of improvement may exist and quickly identify potential areas of constraint. Note: the information displayed is dependent on what the user has security rights to view.
-
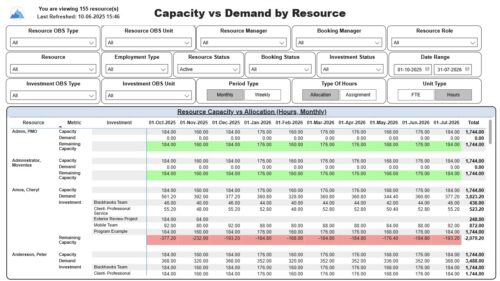 The Capacity vs. Demand by Resource report displays resource capacity and demand at the resource level across investments. The report gives you visibility into the capacity, demand, and remaining capacity by resource. The report displays amounts by week or month, and in total. The amounts might be displayed as hours or FTEs. Report Prerequisites: Verify that you have completed the following prerequisites before you run this report: • The Load Data Warehouse job must be run before you run this report. If the Data Warehouse is not populated, the report will not display any data. Also, most of the report parameters do not display options. • Resource demand allocation amounts display if the resource is allocated to at least one investment and the report display type of hours as allocations. Resource demand assignment amounts display if the resource is assigned to at least one task on the investment and the report displays type of hours as assignments.
 -
 Want to keep your Clarity environment running efficiently? In this class we'll discuss how to maintain your Clarity environment through the use of jobs, processes, and configuration. We'll also cover recommended maintenance activities to ensure your environment is running optimally.
 -
 The industry has been talking about "Connecting Strategy to Execution" for years; Yet many organizations still struggle to make this a reality. During this interactive session, we will guide you through creating a one-page mapping of high-level values, missions, and vision with strategic goals and associated programs of work aligned for the delivery of value.
 -
 Are you struggling to come up with a visualization strategy with all of the options available - widgets, portlets, Jaspersoft, Ad Hoc, etc? This class will explore the various visualization tools available in Clarity and help you understand the best way to output your data. We will provide use cases and examples to assist you in developing a strategy for your organization.
 -
 A Quick Reference Guide to assist in the administrative process of updating an OBS in Clarity. An Organizational Breakdown Structure (OBS) is a hierarchical structure you can use to align resources, projects and investments. Note: the following steps apply when updating a non-financial OBS. The financial OBS (Department and Location OBS) are generally setup as part ofthe Clarity implementation.
 -
A Quick Reference Guide to assist in the use of the Attribute Grid in Clarity’s Modern User Experience Admin Menu. The Attributes grid under MUX Administration menu allows you to perform the following actions on attributes: 1. Define field level security (FLS) 2. Create labels 3. Create tool tips 4. Define display type
-
A Quick Reference Guide to assist in the process of adding Rights to a Group in Clarity’s Modern User Experience. A group is a collection of users that require the same set of access rights. Access rights (Global, OBS, Instance) can be added to a group.
-
This training document is a Rego Consulting Quick Reference Guide to assist with Financial Actuals and Reporting in Clarity’s Modern User Experience. This doc references version 16.2.1 views. Document includes detail on which jobs should be run to ensure project and financial data is synchronized with the latest posted actuals. Information is provided on how to analyze cost plans and how to review actual transactions. Instructions are provided on how to analyze budget plans.
-
This training document is a Rego Consulting Quick Reference Guide to assist with the entering of financial transactions in Clarity’s Classic User Experience. This doc references version 16.2.1 views. Document provides basic information on the definition of a transaction and the composition of transaction items. Detail is provided on how to create a new transaction from the Transaction Entry page of the Classic User Experience. Information is provided on how to enter detail into each individual line item for a transaction.
-
This training document is a Rego Consulting Quick Reference Guide to assist with the management of Budget Plans in Clarity’s Modern User Experience. This doc references version 16.2.1 views. Doc provides detail on how to submit a cost plan for approval, how to approve or reject submitted budgets and also provides additional detail on the rules that apply to the submission of budget plans.


Copyright 2023 • Rego Consulting Corporation • Privacy Policy