-
 A Quick Reference Guide to assist in the process of creating a table in a Jaspersoft Ad-Hoc Report. Uses screenshots to walk you through the process.
 -
 A Quick Reference Guide to assist in the process of creating a crosstab in a Jaspersoft Ad-hoc report. The document uses screenshots to walk you through the process.
 -
 A Quick Reference Guide to assist in the process of creating a chart in Jaspersoft. The guide walks through the steps using screenshots.
 -
 A Quick Reference Guide with tips on creating a Dashboard in Jaspersoft. The document walks through the steps and uses screenshots to show the process.
 -
 XOG & Query Bridge (XQ) is a 2-in-1 Clarity PPM toolset that provides enhanced functionality and an improved user experience when retrieving and inserting data to/from Clarity PPM environments. XQ is available as a Web-based application and also as a downloadable desktop version that supports both On-premise and On-demand Clarity PPM implementations. https://xogbridge.com/
 -
 A Quick Reference Guide to assist in the process of adding filtering for the data to be presented in a Jaspersoft Report. If a report output contains more information than desired, Jaspersoft Reporting provides an interactive filtering capability so only the necessary data is displayed. The filtering conditions can include fields, numbers, dates and text. Filters can be added to reports as they are being created or adding to saved views. Filters cannot be added to a Report.
 -
 A Quick Reference Guide to assist in creating or adding Calculated Fields or Measures to a Jaspersoft Report. Calculated Fields or Measures can be created and added to a new or existing Ad-Hoc view by applying formulas to the measures.
 -
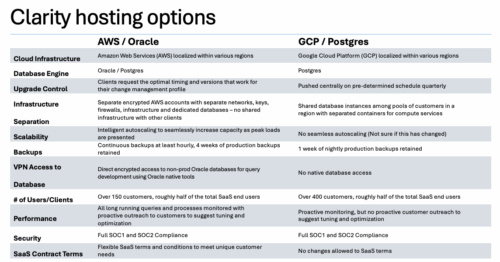

A one page comparison of of the two Clarity SaaS platforms. Broadcom's GCP vs the Rego AWS hosting platforms. Compares Cloud Infrastructure, Database Engine, Upgrade Control, Scalability, Performance and more.
-

A Rego produced document that shows the stock reports and views in Clarity. Also includes views of Power BI reports available in RegoXchange. 193 pages.
-
 A quick reference guide that reviews all of the icons used in the vertical menu bar and provides a quick explanation on their meaning/use.
 -
 This training document is a Rego Consulting Quick Reference Guide to assist with Time Entry Administration Settings for Timesheets. This doc references version 16.0.3 views. Document provides detail on Timesheet Options for the Modern UX and how to enable end user column configuration. Detail is also provided on how end users may configure their timesheet view.
 -
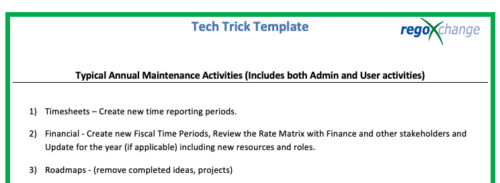 This is a list of 12 typical maintenance items that should be completed for Clarity on an annual basis. There is also a short list of items that should be completed periodically depending on client policies.
 -
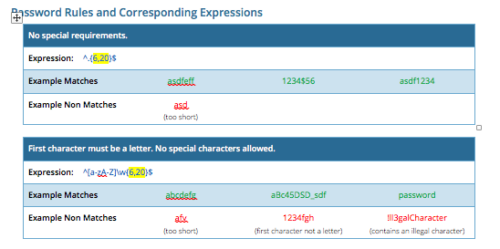 CA PPM allows you to create custom password rules using regex. This document lists expressions for a variety of password rule scenarios. Passwords with length limits default to between 6 and 20 characters. You can change this by editing the highlighted section of the expression. The number before the comma is the minimum password length, and the number after the comma is the maximum password length.
 -
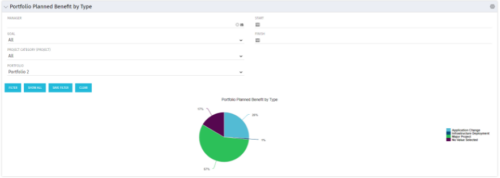 Part of the Business Transformation collection, this pie chart portlet displays realized benefit, grouped by type of project, for portfolio investments. It uses System Provider: Portfolio Investment Provider.
 -
Part of the Business Transformation collection, this pie chart portlet displays realized benefit, grouped by type of project, for portfolio investments. It uses System Provider: Portfolio Investment Provider.
-
Part of the Business Transformation collection, this pie chart portlet displays realized benefit, grouped by type of project, for portfolio investments. It uses System Provider: Portfolio Investment Provider.
-
 Horizontal Bar Graph displays total number of projects for each Business Owner/Sponsor for a selected Project Parent Stage (only Project Investments included). Vertical Axis displays Business Owner name. Horizontal Axis displays number of projects. Filter selectable for any Project Parent Stage. Color coding of bar and legend are synchronized to detail stage under the parent. Total for each detail stage displays on each segment of the bar. A mouseover displays a percent of total for each detail stage.
 -
Horizontal Bar Graph displays total number of projects for each Business Owner/Sponsor for a selected Project Parent Stage (only Project Investments included). Vertical Axis displays Business Owner name. Horizontal Axis displays number of projects. Filter selectable for any Project Parent Stage. Color coding of bar and legend are synchronized to detail stage under the parent. Total for each detail stage displays on each segment of the bar. A mouseover displays a percent of total for each detail stage.
-
 A Quick Reference Guide to assist in entering financial transactions into Clarity’s Classic UX. The guide reviews the basics of transactions entry, create voucher header, entering the line item - details, and entering the line item - transaction.
 -
 Are you considering or analyzing PMO value metrics? This class is a working session will cover lessons learned in PMOs, so you can craft guiding metrics, with or without a tool.
 -
 This training document is a Rego Consulting Quick Reference Guide to assist with the process of entering and submitting timesheets in Clarity’s Modern User Experience. The document reviews Accessing and Selecting Timesheets, Population of the Timesheet, and Updating Time & Submitting.
 -
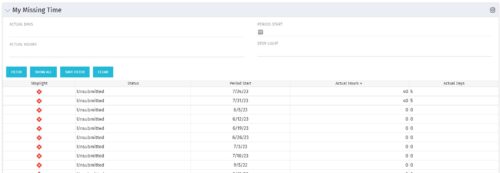 The My Missing Time portlet displays all open time periods for which the logged in user (assuming they are open for time entry with a track mode of Clarity) has a timesheet that is not posted (accommodates for hire and termination dates). The portlet is used as a quick reference for users to view their missing time.
 -
The My Missing Time portlet displays all open time periods for which the logged in user (assuming they are open for time entry with a track mode of Clarity) has a timesheet that is not posted (accommodates for hire and termination dates). The portlet is used as a quick reference for users to view their missing time.
-
 Part of the Business Transformation Collection, this bubble-chart portlet displays investments per their alignment, status and total planned benefit. The: X-axis displays the alignment Y-axis displays the status Bubble-size displays the total planned benefit
 -
Part of the Business Transformation Collection, this bubble-chart portlet displays investments per their alignment, status and total planned benefit. The: X-axis displays the alignment Y-axis displays the status Bubble-size displays the total planned benefit
-
Part of the Business Transformation Collection, this bubble-chart portlet displays investments per their alignment, status and total planned benefit. The: X-axis displays the alignment Y-axis displays the status Bubble-size displays the total planned benefit
-
 Part of the Business Transformation Content collection, this bar chart portlet displays count of ideas per business unit. This provides a holistic view of the idea pipe-line in an organization providing them a high-level of ideas converted, approved, unapproved per business unit.
 -
Part of the Business Transformation Content collection, this bar chart portlet displays count of ideas per business unit. This provides a holistic view of the idea pipe-line in an organization providing them a high-level of ideas converted, approved, unapproved per business unit.
-
Part of the Business Transformation Content collection, this bar chart portlet displays count of ideas per business unit. This provides a holistic view of the idea pipe-line in an organization providing them a high-level of ideas converted, approved, unapproved per business unit.
-
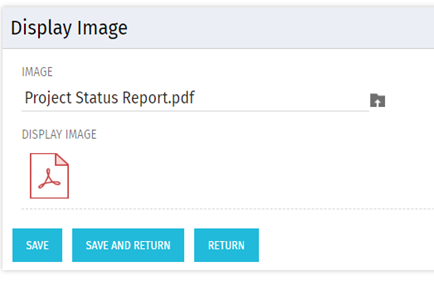 There are many times user’s wants to see the preview of file uploaded on attachment attribute. This Technical Trick will illustrate the steps for an Administrator to preview an attachment. This solution will help to preview PDF, Text file and Image(.png) file. For Microsoft word, PowerPoint and Microsoft Excel, it displays an icon.
 -
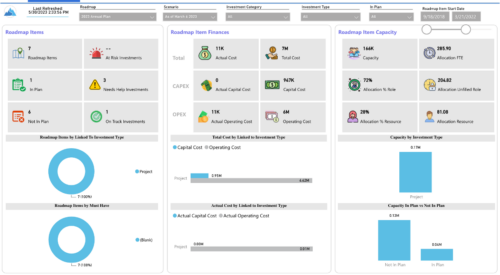
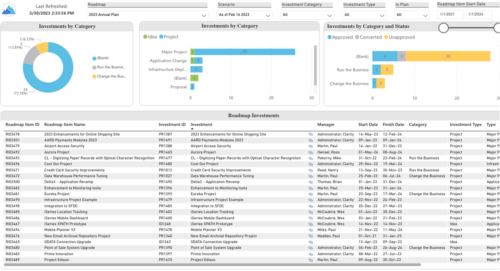 Plan your future work by comparing different scenarios, including in-flight work, and determine the best course of action for your organization. Report Views include:
- Roadmap Details
- Resource Investment Demand
- Roadmap Financials
- Roadmap Investment Gantt
- Roadmap Item Gantt
- Roadmap Overview – Default Scenarios
- Roadmap Overview – Single Roadmap Selection
- Scenario Comparison
-
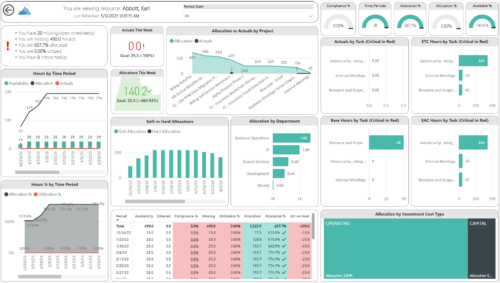
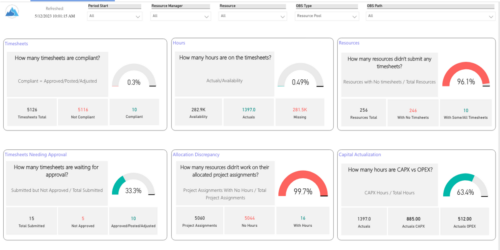 Spot opportunities to improve timesheet accuracy and resource allocations by assessing timesheet compliance and allocation. Report Views include:
- Allocation Variance
- Capex vs Opex
- Hours Detail
- Resource Dtails
- Single Manager Drill Down
- Single Resource Drill Down
- Timesheet Detail
- Timesheet Summary
- Unapproved Timesheets
-
 When configuring the Timesheet Options, the browse window for selecting a lookup on the User Value 1 field only shows a choice of one lookup definition and that is the definition for the stock 'Time Entry User Value 1' Static Lookup. We want to develop our own user-defined dynamic query lookup for use on this field. How can we get this to work properly? Are there any special requirements or configuration considerations that should be reviewed in understanding this functionality for using a custom Time Entry User Value 1 dynamic query lookup? The use of a custom, dynamic lookup on the Timesheet Entry is available with specific requirements and special considerations for storing and displaying data for this field. It is recommended that you use the stock, 'Time Entry User Value 1' Static Lookup if possible.


Copyright 2023 • Rego Consulting Corporation • Privacy Policy