-
 This portlet will allow administrators or other managers to see what resources have been granted instance rights to any investment. Filtering is available by resource, investment or right.
 -
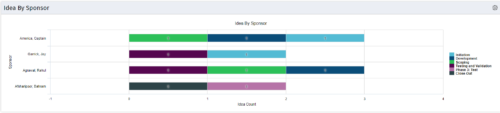 This portlet uses a bar graph to show the count of ideas by stage - grouped by the sponsor OBS. The X-axis displays the count and the Y-axis denotes the sponsor.
 -
This portlet uses a bar graph to show the count of ideas by stage - grouped by the sponsor OBS. The X-axis displays the count and the Y-axis denotes the sponsor.
-
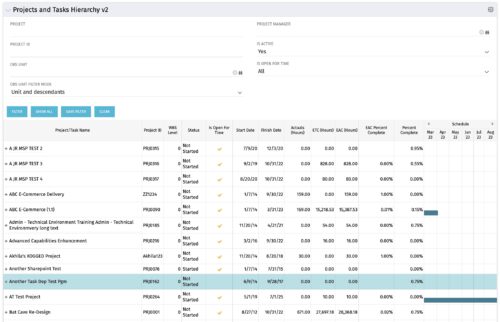 Grid Portlet displays project and task data--including name, dates, status, effort, %Complete, and schedule. Portlet initially displays project data. But there is a + sign toggle, which, when clicked, reveals task data, and the toggle becomes a – sign. User can choose to Automatically Expand all levels from Options Icon>Configure>List Column Section>Options. Portlet supports up to 10 levels of WBS. Portlet filterable by project name and ID, OBS structure, manager name, active/inactive, and open for time entry.
 -
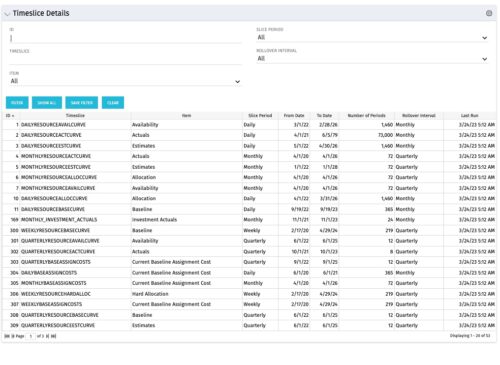 This allows users without admin access to see the timeslice settings and also allows the data to be exported to excel easily. Many organizations like to document their timeslice settings which is a manual process as you cannot export the timeslice page to excel. This allows them to periodically export the portlet results to excel to meet their documentation requirements.
 -
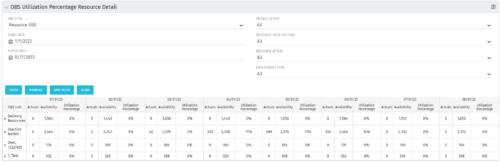
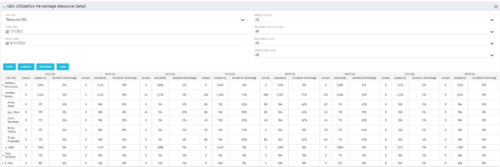 This portlet depicts the Resource Utilization by comparing actual hours booked as a percentage of total resource availability grouped and totaled by OBS Unit in a hierarchical fashion. Resource availability is determined by the working days and daily availability on the individual Resource Calendar and is depicted on a Monthly basis. This portlet uses Monthly Times and the Time Slice job may need to run before the end user will see results in the portlet. The portlet filters for Project Activity, Resource Open for Time, Resource Activity, and Employment time have been added to OBS Type and the Start and Finish dates. The OBS summary totals show on a single line, but can be clicked (+) to roll out the details behind each OBS total.
 -
 This view depicts the Resource Utilization by comparing actual hours booked as a percentage of total resource availability grouped and totaled by OBS Unit in a hierarchical fashion. Resource availability is determined by the working days and daily availability on the individual Resource Calendar and is depicted on a Monthly basis. This portlet uses Monthly Times and the Time Slice job may need to run before the end user will see results in the portlet. The portlet filters for Project Activity, Resource Open for Time, Resource Activity, and Employment time have been added to OBS Type and the Start and Finish dates.
 -
This view depicts the Resource Utilization by comparing actual hours booked as a percentage of total resource availability grouped and totaled by OBS Unit in a hierarchical fashion. Resource availability is determined by the working days and daily availability on the individual Resource Calendar and is depicted on a Monthly basis. This portlet uses Monthly Times and the Time Slice job may need to run before the end user will see results in the portlet. The portlet filters for Project Activity, Resource Open for Time, Resource Activity, and Employment time have been added to OBS Type and the Start and Finish dates.
-
 This portlet shows the variance between the budgeted cost and the planned cost for projects. This allows for the variance to be displayed between what was planned and what was approved. This provides the PMs with the ability to better plan the costs.
 -
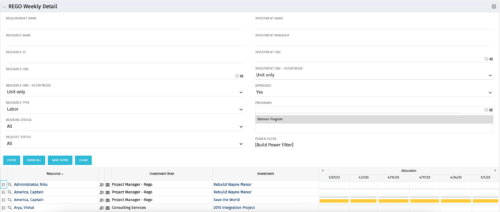 This is the same portlet as the out of the box Weekly Detail with an additional filter element for Program (multiple select). Portlet displays resource allocations graphically for each project in the specified program(s), for the next six weekly periods. Portlet filterable by numerous project, resource, and assignment attributes. Graphical representation shows Resource Availability Threshold and Allocation in hours, as a mouse-over.
 -
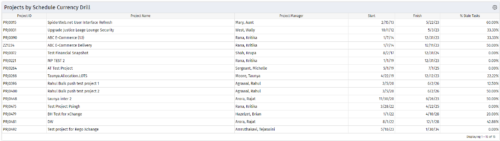
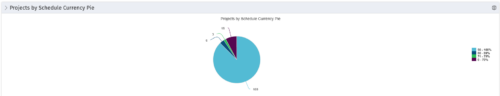 Pie Chart Portlet displays counts of active projects with various Stale ratings. Calculation is Percent Stale Tasks = number of open (not completed) tasks with a finish date over 15 days old, divided by total open tasks. Filterable by OBS structure and project manager. Data label = project count. Mouse-over and Legend labels = stale rating. More than 90% Stale means 90 to 100% of open tasks on a project have finish dates older than 15 days. More than 80% Stale means 80 to 89% of open tasks on a project have finish dates older than 15 days. Less than 70% Stale means fewer than 70% of open tasks on a project have finish dates older than 15 days. By clicking on pie slice, a drilldown grid portlet appears with listing of projects and their Stale Ratings.
 -
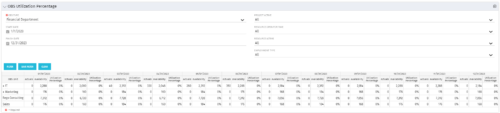
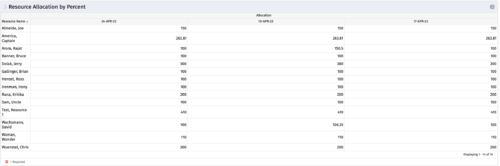 This portlet shows resource allocation by percent and hours, and gives ability to filter on allocation percent. The RM can use the portlet to see if any of the resources is over/ under allocated.


Copyright 2023 • Rego Consulting Corporation • Privacy Policy