-
 What should I expect to see within my organization related to PM over the next couple of years? How should I prepare my PMs, PMOs, or myself to embrace the new trends within the industry? This class will share Rego's observations on industry trends within PPM.
 -
 A review of how AbbVie is driving greater visibility into projects at the Executive level and is eliminating/reducing duplicative work across the Business Technology Solutions organization by simplifying the overall PPM landscape. This has been accomplished through implementation of consistent processes supported by Clarity as well as through system integrations with legacy systems like SAP, Fieldglass, and other Project Scheduling tools.
 -
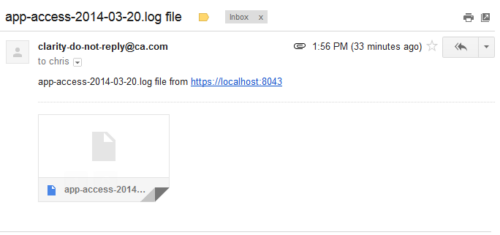 This process emails a log file, as an attachment, to the specified email address. This is useful for On-Demand clients to be able to view the entire log file instead of just a partial one in the “security.logs” hidden page.
 -
 The Action Item Reassignment – Workflow provides the ability to reassign an action item(s) that has been sent out to a resource. You first choose the resource who currently has the action item(s) sitting in their queue. Next, you choose the resource you want to reassign the action item(s) to. Finally, you select one to many action items you want to re-associate before running the process. After all the fields are set, the process can be run which will re-associate the action items from one resource to the other.
 -
The Action Item Reassignment – Workflow provides the ability to reassign an action item(s) that has been sent out to a resource. You first choose the resource who currently has the action item(s) sitting in their queue. Next, you choose the resource you want to reassign the action item(s) to. Finally, you select one to many action items you want to re-associate before running the process. After all the fields are set, the process can be run which will re-associate the action items from one resource to the other.
-
 You are no longer regulated to the desktop browser to respond to action items. Learn how Rego solved this problem using just your email. We’ll talk about various use cases where you would get maximum benefit from a simple response on an action item directly from your email. It doesn’t matter if you are using email on your desktop, laptop, phone or tablet. The Action Item Responder as you covered.
 -
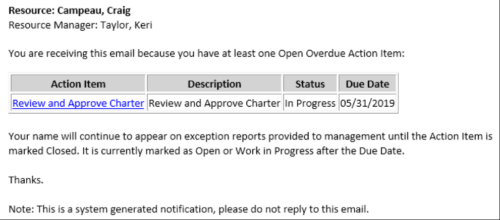 This Process sends an email to every Action Item Assignee where the Due Date/Time has passed and the Status is either Open, or In Progress. Users may want to modify this stalker to include Status = Deferred. In addition, the Resource Manager for the Assignee receives a copy of the email. In order to generate emails, the SMTP gateway must be up and running and Resources must have a valid email address.
 -
This Process sends an email to every Action Item Assignee where the Due Date/Time has passed and the Status is either Open, or In Progress. Users may want to modify this stalker to include Status = Deferred. In addition, the Resource Manager for the Assignee receives a copy of the email. In order to generate emails, the SMTP gateway must be up and running and Resources must have a valid email address.
-
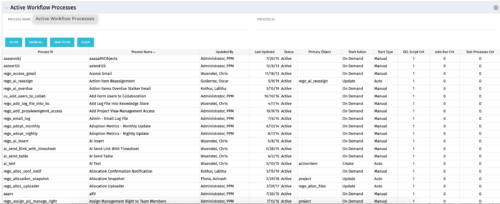 The Active Workflow Processes allows you to view all of the workflow processes within the system. It shows information about the process: the objects related, the start type, and if the process has sub-processes, jobs, or GEL scripts. This portlet is used by admins to determine how many processes are currently running in the system and on which objects. It will also display the start action, how many GEL scripts reside in the process, the run count and how many the sub-processes each process has. This information is helpful during upgrades and other testing.
 -
The Active Workflow Processes allows you to view all of the workflow processes within the system. It shows information about the process: the objects related, the start type, and if the process has sub-processes, jobs, or GEL scripts. This portlet is used by admins to determine how many processes are currently running in the system and on which objects. It will also display the start action, how many GEL scripts reside in the process, the run count and how many the sub-processes each process has. This information is helpful during upgrades and other testing.
-
 Actuals & ETC by Resource Assignment report provides project managers a single place to view Actuals and ETC associated with resources across multiple Tasks and Projects. It displays the following: Actual and ETC Hours by Start Date: Stacked Column chart that displays the total Actual hours and ETC hours per month of fiscal period. Grey color indicates Actuals and Purple indicates ETC hours during that month. Grid: Displays Investment name, Task, Assigned resource ETC and Actual hours per month of fiscal period. It also displays aggregated column and row totals for Actuals and ETC hours. You can further narrow your search by OBS Type, OBS Path & Start Date range.
 -
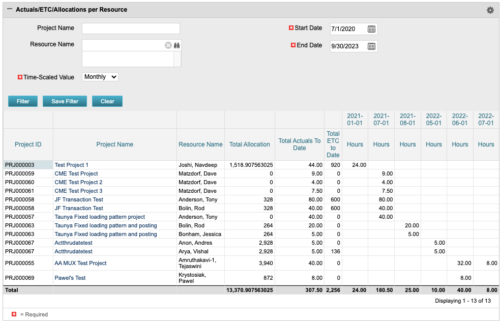 The portlet displays posted time by project for the logged in user based on time period and date range. This allows the user to see at a glance their ETC and actuals on the projects. The portlet displays the Total Allocation and Total Actuals to Date for the user on the projects they are allocated/assigned to. The actuals are displayed per month in the form of TSVs.
 -
The portlet displays posted time by project for the logged in user based on time period and date range. This allows the user to see at a glance their ETC and actuals on the projects. The portlet displays the Total Allocation and Total Actuals to Date for the user on the projects they are allocated/assigned to. The actuals are displayed per month in the form of TSVs.


Copyright 2023 • Rego Consulting Corporation • Privacy Policy