-
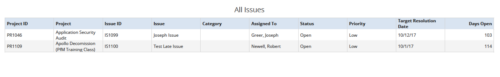 All Issues report provides the Project Managers a single place to view all the Issues across multiple projects. User can view only the projects that he has access to. This report provides Issue information such as ID, Name, Category, Assigned To, Status, Priority, Target Resolution Date and Days Open ( # of days Issue is open ) User can further narrow their search by OBS Type & Path, Issue Name, Project Name, Project ID, Is Project Active?, Issue Owner, Issue Status, Issue Target Resolution Date, Issue Category and Issue Priority.
 -
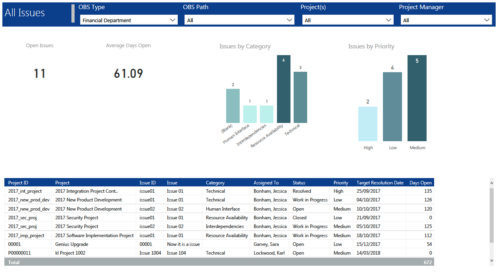 All Issues report provides project managers a single place to view KPIs related to Issues. All the KPIs are depicted in various visualizations. Open Issues: Scorecard that displays the # of Issues that are not closed or resolved. Average Days Open: Scorecard that displays the # of days on an average an issue is in open state. Issue category: Column chart that displays # of Issues by category. X axis displays various Issue categories. Data labels indicate the number of Issues associated with that category. Issue Priority: Column chart that displays # of Issues by priority. X axis displays various Issue priority. Data labels indicate the number of Issues associated with that priority. Grid: Displays Issue details such as Project ID, Project, Issue ID, Issue, Category, Assigned To, Status, Priority, Target Resolution Date and Days Open. You can further narrow your search by OBS Type, OBS Path, Project(s) and Project Manager.
 -
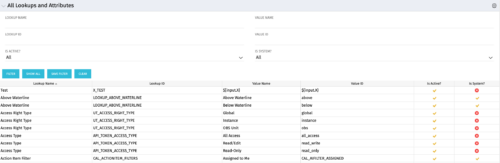 The All Lookups and Attributes portlet provides the ability to see all static lookups in the system, as well as their lookup values. Ability to filter and view the population by lookup name and ID, value name and ID, whether or not the item is active, and whether or not the item is a system (seeded) value. A system value is a record that comes with a base installation of Clarity as opposed to a value that was added manually or through a Clarity Add-in.
 -
The All Lookups and Attributes portlet provides the ability to see all static lookups in the system, as well as their lookup values. Ability to filter and view the population by lookup name and ID, value name and ID, whether or not the item is active, and whether or not the item is a system (seeded) value. A system value is a record that comes with a base installation of Clarity as opposed to a value that was added manually or through a Clarity Add-in.
-
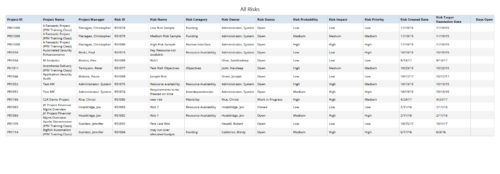 All Risks report provides the project manager a single place to view risks across multiple projects. This report displays Project Information such as ID & Name, Risk Information such as its ID, Category, Owner, Status, Probability, Impact, Priority, Created Date, Target Resolution Date & Days Open. You can further narrow your search by Risk Status, Risk Name, Risk Category, Risk Impact, Risk Priority, Risk Owner, Project Name and Project Manager.
 -
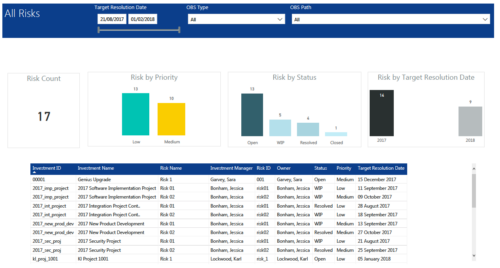 All Risks report provides project managers a single place to view KPIs related to Risks. All the KPIs are depicted in various visualizations. Risk Count: Scorecard that displays the # of Risks for the selected criteria. Risk Priority: Column chart that displays # of Risks by Priority. X axis displays various Risk Priorities. Data labels indicate the number of Risks associated with that category. Risk by Status: Column chart that displays # of Risks by Status. X axis displays various Risk statuses. Data labels indicate the number of Risks associated with that status. Risk by Target Resolution Date: Column chart that displays # of Risks by year of Target Resolution Date. X axis displays Year. Data labels indicate the number of Risks associated with that category. Grid: Displays Risk details such as Investment ID, Investment Name, Investment Manager, Risk ID, Risk Name, Owner, Status, Priority and Target Resolution Date. You can further narrow your search by OBS Type, OBS Path and Target Resolution Date range.
 -
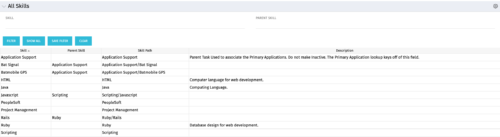 The All Skills portlet displays active skills available in the skills hierarchy, thus providing visibility to these values, without requiring administrative rights to be granted to the user. Viewing the skills list together in one view will allow the user to easily determine which skills they wish to add to their profile. The user may filter by Skill Name, or for skills associated with a particular parent skill.
 -
The All Skills portlet displays active skills available in the skills hierarchy, thus providing visibility to these values, without requiring administrative rights to be granted to the user. Viewing the skills list together in one view will allow the user to easily determine which skills they wish to add to their profile. The user may filter by Skill Name, or for skills associated with a particular parent skill.
-
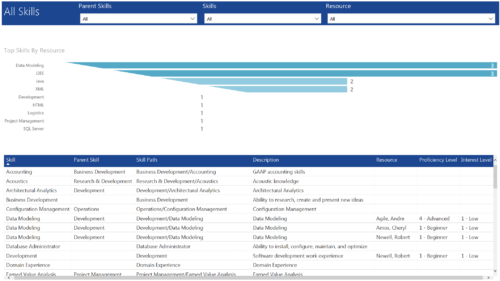 All Skills report provides project managers a single place to view number of resources having a particular skill and its detailed information. This report contains a bar graph and a grid. Top Skills by Resource: Bar graph that displays # of resources having a particular skill. Y- Axis represents various skills available in the system. Resource and Skill details grid: Grid that displays information such as Skill, its parent skill, Skill path, Skill Description, Resource having that skill & his proficiency and interest level in that skill. You can further narrow your search by Parent Skills, Skills and Resource.
 -
 The All Status Reports portlet displays any published Status Report related to a project or across multiple projects. The filter then allows the user to narrow their search by Project Manager, Project, Status or Overall Status Category (overall, cost & effort, scope or schedule). The user may also select if they wish to view only current Status Reports, or to include historical reports as well. The portlet provides the project manager a single place to view all of the status reports without having to go into each project individually, and allows for more efficient management and reporting across projects. Note: Only the projects that the user has view rights to will show up in the list.
 -
The All Status Reports portlet displays any published Status Report related to a project or across multiple projects. The filter then allows the user to narrow their search by Project Manager, Project, Status or Overall Status Category (overall, cost & effort, scope or schedule). The user may also select if they wish to view only current Status Reports, or to include historical reports as well. The portlet provides the project manager a single place to view all of the status reports without having to go into each project individually, and allows for more efficient management and reporting across projects. Note: Only the projects that the user has view rights to will show up in the list.
-
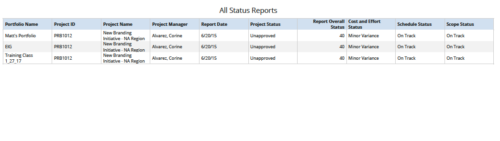 All Status Reports is a grid report that provides project managers a single place to current status report for a single project or across multiple projects. This report provides project information such as ID, Name, Manager, Status, Status report KPI’s (Report overall status, Cost and Effort status, Schedule status & Scope Status) and Portfolio Name. You can further narrow your search by OBS Type, OBS Path, Project Name, Project Manager, Status, Overall Status and Portfolio Name.
 -
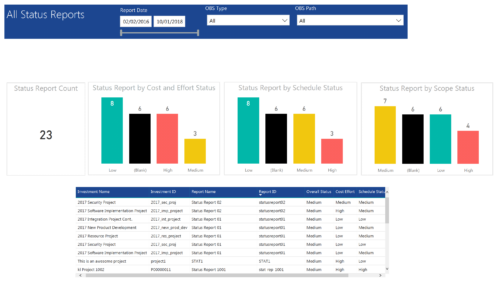 All Status report provides project managers a single place to view KPIs related to Status Reports. All the KPIs are depicted in various visualizations. Status Report Count: Scorecard that displays the # of Status Reports for the selected criteria. Status Report by Cost Effort Status: Column chart that displays # of Status Reports by Cost Effort. X axis displays various Cost Effort Status. Data labels indicate the number of Status Reports associated with that category. Status Report by Schedule Status: Column chart that displays # of Status Reports by Schedule Status. X axis displays various Schedule statuses. Data labels indicate the number of Status Reports associated with that status. Status Report by Scope Status: Column chart that displays # of Status Reports by Scope Status. X axis displays various Scope statuses. Data labels indicate the number of Status Reports associated with that status. Grid: Displays Status Report details such as Investment ID, Investment Name, Report Name, Report ID, Overall Status, Cost Effort, Schedule Status and Scope Status. You can further narrow your search by OBS Type, OBS Path and Report Date range
 -
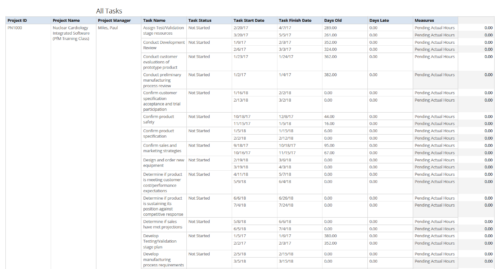 All Tasks report provides the Project Managers a single place to view all the tasks associated with a project(s). User can view only the investments that he has access. Project Managers can use this report to view the progress of the tasks and check how the tasks are performing against baseline date. User can further narrow their search by OBS Type & Path, Investment Name, Month Start Date and Is Project Active?.
 -
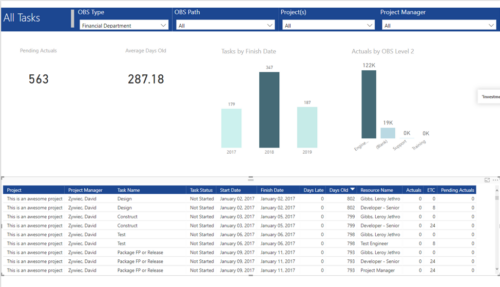 All Tasks report provides project managers a single place to view KPIs related to Tasks. All the KPIs are depicted in various visualizations. Pending Actuals: Scorecard that displays the # of Actuals that are still open and not yet posted. Average Days Old: Scorecard that displays the average number of Task Days Old. Days Old is the difference between Task Finish date and Today’s Date (when Today’s Date > Task Finish date. In other cases, it is zero) Tasks by Finish Date: Column chart that displays # of Tasks by Year of Finish date. X axis display Calendar years. Data labels indicate the number of Tasks finish date within that year. Actuals by OBS level 2: Column chart that displays sum of Task Actuals by OBS level 2. X axis display OBS level2. Data labels indicate the Actuals within that OBS level2. Grid: Displays Risk details such as Project Name, Project Manager, Task Name, Task Status, Start Date, Finish Date, Days Late, Days Old, Actuals, ETC and Pending Actuals Days Late is the difference between Task Finish date and Baseline Finish Date (when Baseline Finish Date > Task Finish date. In other cases, it is zero) You can further narrow your search by OBS Type, OBS Path, Project(s) and Project Manager.
 -
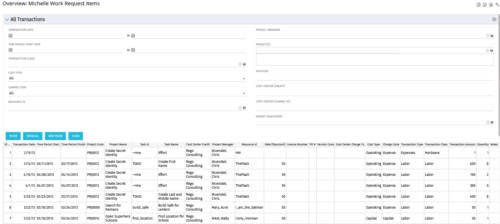 The All Transactions portlets have the capability to display any transaction within the system. Transactions from any type of investment can be viewed on this page. There are two version of this process:
- All Transactions (with security) – this will display rows only where the logged in resource has access to cost plans for projects or ideas. The portlet will check instance, OBS and global rights.
- All Transactions (without security) – will display all rows, regardless of cost plan access rights.
Column Label Description ID An unique identifier for each row displayed in the portlet. Transaction Date The data the transaction has been coded to. Time Period Start For transactions arising from timesheet entries, this will show the start period of the timesheet. Time Period Finish For transactions arising from timesheet entries, this will show the finish period of the timesheet. Project Code The ID of the investment. Project Name The name of the investment. Task ID The ID of the investment task where the actual cost has been assigned. Task Name The name of the investment task where the actual cost has been assigned. Cost Center Credit The department assigned to the resource where a cost needs to be credited. Project Manager The resource managing the investment. Resource ID The ID for the resource that has been assigned the cost. Rate (Standard) The rate for the cost. Invoice Number The invoice number. May come from a manual transaction or may be imported from a financial system integration. PO # The purchase order number. May come from a manual transaction or may be imported from a financial system integration. Vendor Code The vendor code that has been listed against the transaction. Cost Centre Charge To The department assigned to the resource where a cost needs to be charged. Cost Type Indicates whether the transaction is capital or operating. Charge Code The charge code assigned to the transaction as per the Clarity Charge Code list. Transaction Type Labour, Expense, Equipment or Material. Transaction Class The transaction class assigned to the transaction as per the Clarity transaction class list. Transaction Amount Rate x Quantity. Quantity The number of units. Notes Free text field for the transaction. -
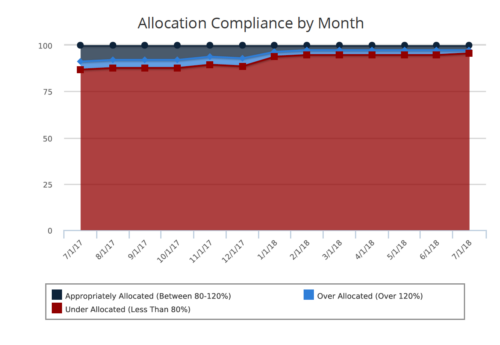 Allocation Compliance Area Chart provides the resource manager a single place to view the Monthly Resource Allocation compliance for all resources in the form of an Area chart. Allocation Compliance is calculated based on the value of 'Availability to Allocation Hours %' Allocation Compliance is 'Under Allocated (Less Than 80%)' WHEN 'Availability to Allocation Hours %’ is less than 80 Allocation Compliance is 'Appropriately Allocated (Between 80-120%)' WHEN 'Availability to Allocation Hours %' is between 80 and 120 Allocation Compliance is 'Over Allocated (Over 120%)' WHEN 'Availability to Allocation Hours %' is greater than 120 User can further narrow their search by Resource Is Active?, OBS Type, OBS Path and Month Start Date. User can use exact dates or relative dates for Month Start Date filter parameter.
 -
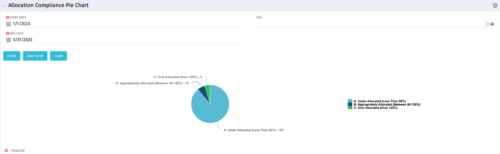
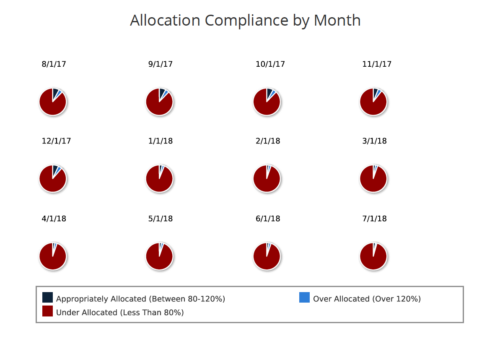 Allocation Compliance Pie Chart provides the resource manager a single place to view the Monthly Resource Allocation compliance for all resources in the form of a Pie chart. A separate Pie chart is displayed for each month. Allocation Compliance is calculated based on the value of 'Availability to Allocation Hours %'. Allocation Compliance is 'Under Allocated (Less Than 80%)' WHEN 'Availability to Allocation Hours %’ is less than 80. Allocation Compliance is 'Appropriately Allocated (Between 80-120%)' WHEN 'Availability to Allocation Hours %' is between 80 and 120. Allocation Compliance is 'Over Allocated (Over 120%)' WHEN 'Availability to Allocation Hours %' is greater than 120. User can further narrow their search by Resource Is Active? , OBS Type, OBS Path and Month Start Date. User can use exact dates or relative dates for Month Start Date filter parameter.
 -
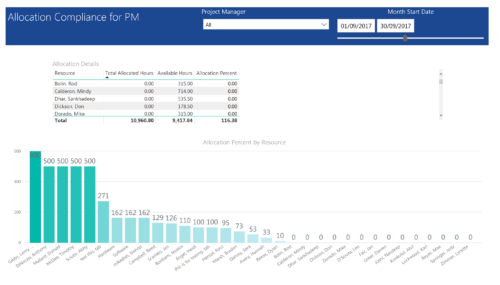 Allocation Compliance by PM report provides project managers a single place to view Available hours, Allocation Hours and Allocation Percentage of Investment Team Resources. It considers the investments of selected project manager and it displays the following: Allocation Details Grid: Displays Resource and its Allocated hours, Available hours and Allocation percentage (Allocated hours/Available Hours) Allocation Percent by Resource: Column chart that displays Allocation Percentage for various resources during the selected Time frame. You can further narrow your search by Project Manager & Month Start Date range.
 -
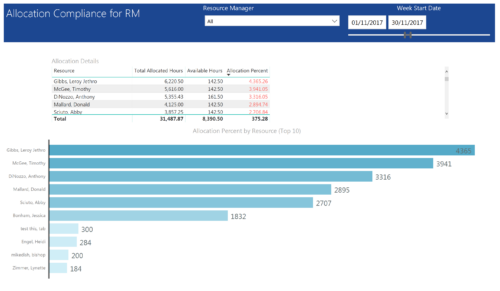 Allocation Compliance by RM report provides resource managers a single place to view Available hours, Allocation Hours and Allocation Percentage of Resources. It considers the resources of selected resource manager and it displays the following: Allocation Details Grid: Displays Resource and its Allocated hours, Available hours and Allocation percentage (Allocated hours/Available Hours) Allocation Percent by Resource: Bar chart that displays Allocation Percentage (top 10) for various resources during the selected Time frame. You can further narrow your search by Resource Manager & Month Start Date range.
 -
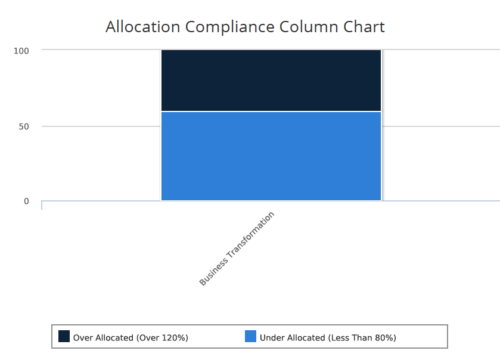 Allocation Compliance Column Chart provides the resource manager a single place to view the Allocation compliance information in the form of a stacked column chart. Allocation Compliance is calculated based on the value of 'Availability to Allocation Hours %'. Allocation Compliance is 'Under Allocated (Less Than 80%)' WHEN 'Availability to Allocation Hours %’ is less than 80. Allocation Compliance is 'Appropriately Allocated (Between 80-120%)' WHEN 'Availability to Allocation Hours %' is between 80 and 120. Allocation Compliance is 'Over Allocated (Over 120%)' WHEN 'Availability to Allocation Hours %' is greater than 120. User can further narrow their search by Resource Is Active?, OBS Type & Path, Associated Project OBS?, Allocation Start Date, Investment Name and Resource Manager. User can use exact dates or relative dates for Allocation Start Date filter parameter.
 -
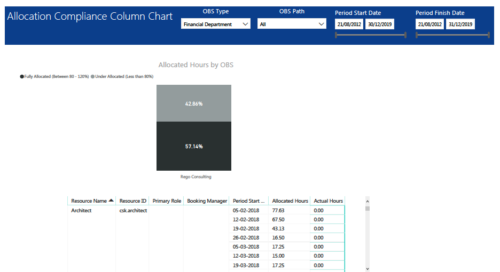 Allocation Compliance Column Chart report provides resource managers a single place to view Allocation compliance for various resources. It displays the following: Allocated Hours by OBS chart: Stacked Column chart that displays percentage of resources that are fully allocated (80 -120 %) and under allocated (less than 80%) for a particular OBS and selected period range. Grid: Displays Resource Name, Resource Id, Primary Role, Booking Manager, Period, Allocated hours and Actual hours during that period. You can further narrow your search by OBS Type, OBS Path & Period Start Date range.
 -
 The Allocation Compliance by Person (Project Manager) portlet gives a view of resource allocation compliance for active resources on the team of an investment the logged in user is the manager for. It allows the PM to see resources on their project over the coming months and whether they are over or under allocated. This portlet leverages the daily allocation and daily availability slices as well as only active investments. The portlet provides filters for specific dates, filtering by resource ID, and resource name may also be added.
 -
The Allocation Compliance by Person (Project Manager) portlet gives a view of resource allocation compliance for active resources on the team of an investment the logged in user is the manager for. It allows the PM to see resources on their project over the coming months and whether they are over or under allocated. This portlet leverages the daily allocation and daily availability slices as well as only active investments. The portlet provides filters for specific dates, filtering by resource ID, and resource name may also be added.
-
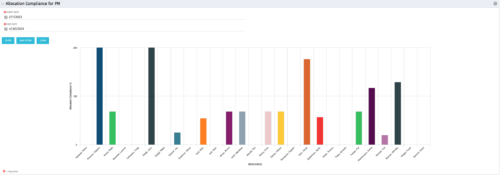
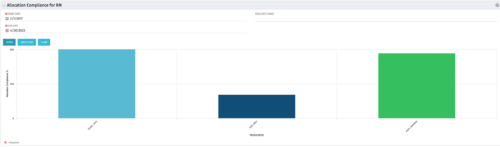
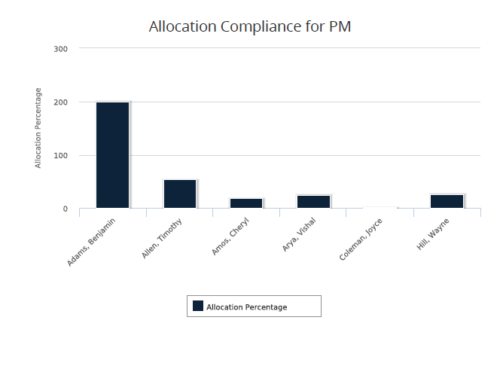 Allocation Compliance for PM report gives a view of resource Allocation percentage for active resources on the team of an investment for a selected Investment Manager. It allows the PM to see resources on their project over the coming months and whether they are over or under allocated. Allocation Percentage is calculated as (‘Allocated Hours’ / ‘Available Hours’) * 100. User can further narrow their search Month Start Date and Investment Manager. User can use exact dates or relative dates for Month Start Date filter parameter.
 -
 The Allocation Compliance by Resource (Resource Manager) portlet gives a view of resource allocation compliance for all active resources the logged in user is the Resource Manager for. It allows the RM to see resources they manage over the coming months and whether they are over or under allocated. This portlet leverages the daily allocation and daily availability slices as well as only active investments. The portlet provides filters for specific dates, filtering by resource ID, and resource name may also be added.
 -
The Allocation Compliance by Resource (Resource Manager) portlet gives a view of resource allocation compliance for all active resources the logged in user is the Resource Manager for. It allows the RM to see resources they manage over the coming months and whether they are over or under allocated. This portlet leverages the daily allocation and daily availability slices as well as only active investments. The portlet provides filters for specific dates, filtering by resource ID, and resource name may also be added.
-
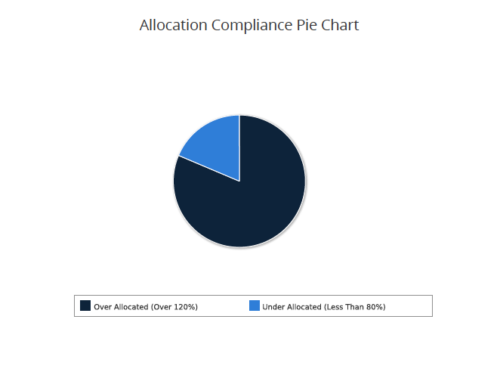 Allocation Compliance Pie Chart provides the resource manager a single place to view the Allocation compliance information in the form of a Pie chart. Allocation Compliance is calculated based on the value of 'Availability to Allocation Hours %'. Allocation Compliance is 'Under Allocated (Less Than 80%)' WHEN 'Availability to Allocation Hours %’ is less than 80. Allocation Compliance is 'Appropriately Allocated (Between 80-120%)' WHEN 'Availability to Allocation Hours %' is between 80 and 120. Allocation Compliance is 'Over Allocated (Over 120%)' WHEN 'Availability to Allocation Hours %' is greater than 120. User can further narrow their search by Resource Is Active?, OBS Type, OBS Path, Allocation Start Date, Investment Name and Resource Manager. User can use exact dates or relative dates for Allocation Start Date filter parameter.
 -
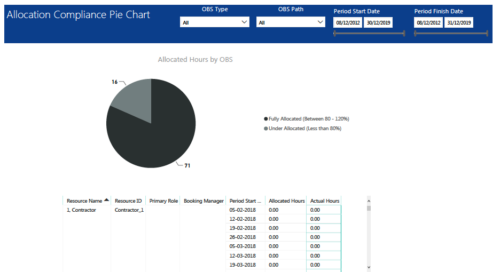 Allocation Compliance Pie Chart report provides resource managers a single place to view Allocation compliance for various resources. It displays the following: Allocated Hours by OBS chart: Pie chart that displays percentage of resources that are fully allocated (80 -120 %) and under allocated (less than 80%) for a particular OBS and selected period range. Grid: Displays Resource Name, Resource Id, Primary Role, Booking Manager, Period, Allocated hours and Actual hours during that period. You can further narrow your search by OBS Type, OBS Path & Period Date range.
 -
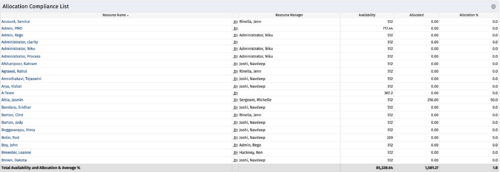
This Allocation Compliance Drilldown Enhancement portlet is used in conjunction with the Allocation Compliance Pie Chart. Once the user selects a specific section of the chart, the Allocation Compliance Drilldown Enhancement will display a list of resources fulfilling that selection. The Allocation Compliance list portlet shows the Resource Name, the Resource Manager, Availability, Allocated Hours and Allocation % for the selection. Note: The Allocation compliance pie chart is displayed first based on the filter selection i.e., Start Date, End Date and OBS. The pie chart is displayed as per the following three slices of the pie: Under Allocated (Less than 80%) Appropriately Allocated (Between 80-120%) Over Allocated (Above 120%) The slice of a pie can be clicked to display resource allocation compliance information in the Allocation Compliance List portlet, as described earlier. The table below describes the available columns in the Allocation Compliance list portlet. The first 5 are configured in the default view: Column Label Description Resource Name Name of the Resource Resource Manager Resource Manager Availability Resource Availability Allocated Resource Allocation Allocation % Resource Allocation % Res_id Unique identifier of the Resource -
This Allocation Compliance Drilldown Enhancement portlet is used in conjunction with the Allocation Compliance Pie Chart. Once the user selects a specific section of the chart, the Allocation Compliance Drilldown Enhancement will display a list of resources fulfilling that selection. The Allocation Compliance list portlet shows the Resource Name, the Resource Manager, Availability, Allocated Hours and Allocation % for the selection. Note: The Allocation compliance pie chart is displayed first based on the filter selection i.e., Start Date, End Date and OBS. The pie chart is displayed as per the following three slices of the pie: Under Allocated (Less than 80%) Appropriately Allocated (Between 80-120%) Over Allocated (Above 120%) The slice of a pie can be clicked to display resource allocation compliance information in the Allocation Compliance List portlet, as described earlier. The table below describes the available columns in the Allocation Compliance list portlet. The first 5 are configured in the default view: Column Label Description Resource Name Name of the Resource Resource Manager Resource Manager Availability Resource Availability Allocated Resource Allocation Allocation % Resource Allocation % Res_id Unique identifier of the Resource


Copyright 2023 • Rego Consulting Corporation • Privacy Policy