-
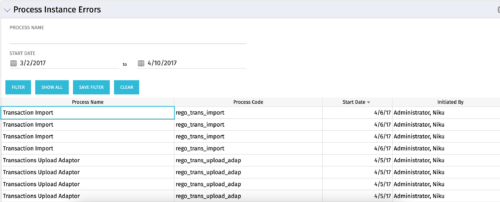 The Process Instance Errors portlet will show all processes that error. This portlet will assist the administrator with determining which processes are in error and whether to skip, retry, or cancel. It will display the process name, code, start date, and who initiated the process. You may also filter by any of the criteria listed in the grid.
 -
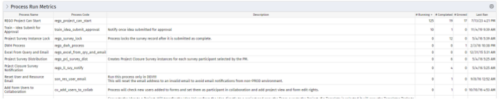 For each process, the Process Run Metrics portlet shows the Process Name, Process Code, Description, # Running, # Completed, # Errored, and Last Run Date. This portlet is ideal for system administrators and support staff needing to monitor the health of the environment. Viewers of this portlet can get a sense of the complexity & health of the environment with the # of processes running and visibility into processes that errored out. The table below describes the available filter fields in the portlet.
Column Label Description Process Name Name of the process Start Date Start date of the process’s last ran date End Date End date of the process’s last ran date Description Description of the process Process ID ID of the process -
For each process, the Process Run Metrics portlet shows the Process Name, Process Code, Description, # Running, # Completed, # Errored, and Last Run Date. This portlet is ideal for system administrators and support staff needing to monitor the health of the environment. Viewers of this portlet can get a sense of the complexity & health of the environment with the # of processes running and visibility into processes that errored out. The table below describes the available filter fields in the portlet.
Column Label Description Process Name Name of the process Start Date Start date of the process’s last ran date End Date End date of the process’s last ran date Description Description of the process Process ID ID of the process -
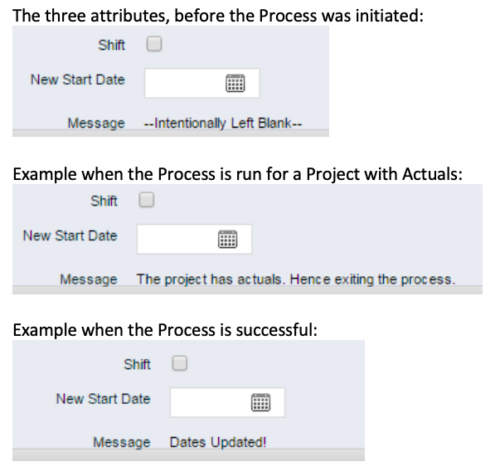 This process, Shift Project Dates, helps Project Managers change an entire Project / Idea’s dates to a new start date. Once the three attributes are added to the Idea /Project Views, the PM can trigger the process by entering a date in the New Start Date field and checking the Shift checkbox. The process runs automatically on Save. The process calculates the date difference between the original Start Date and New Start Date then shifts all Allocation, Task, and Assignment dates by the calculated difference. For example, if a Project is set to begin on January 1st and needs to be pushed to a February 1st start date, the process first determines that there are 31 days between the original start date and the new date. Next the process increases the start date for each Task, Allocation and Assignment by 31 days. NOTE: The process will shift Allocation dates regardless of resource restrictions such as a Termination Date or non-working time as marked on their calendar. The Team page will reflect the Available Start and Finish as shifted by the process, but the Allocation hours and % will take unavailable time into account. For example, if a shift process sets the start date for a resource to be after their date of termination the dates will change by the date difference, but the Allocation hours will correctly be calculated as zero.
 -
This process, Shift Project Dates, helps Project Managers change an entire Project / Idea’s dates to a new start date. Once the three attributes are added to the Idea /Project Views, the PM can trigger the process by entering a date in the New Start Date field and checking the Shift checkbox. The process runs automatically on Save. The process calculates the date difference between the original Start Date and New Start Date then shifts all Allocation, Task, and Assignment dates by the calculated difference. For example, if a Project is set to begin on January 1st and needs to be pushed to a February 1st start date, the process first determines that there are 31 days between the original start date and the new date. Next the process increases the start date for each Task, Allocation and Assignment by 31 days. NOTE: The process will shift Allocation dates regardless of resource restrictions such as a Termination Date or non-working time as marked on their calendar. The Team page will reflect the Available Start and Finish as shifted by the process, but the Allocation hours and % will take unavailable time into account. For example, if a shift process sets the start date for a resource to be after their date of termination the dates will change by the date difference, but the Allocation hours will correctly be calculated as zero.
-
 The need to report and organize work around the Products continues to grow. Join this session to hear how Project and Product Management can thrive together in Clarity.
 -
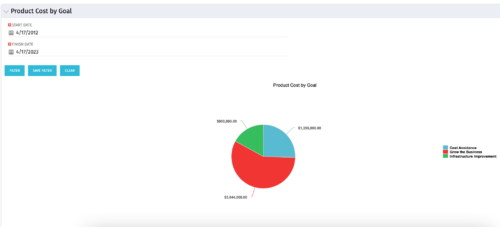 The Product Cost by Goal portlet displays the planned cost of all active products within a timeframe, summarized by goal in a pie chart. This portlet provides management with a quick overview of cost by goal within a year without navigating to each product individually.
 -
The Product Cost by Goal portlet displays the planned cost of all active products within a timeframe, summarized by goal in a pie chart. This portlet provides management with a quick overview of cost by goal within a year without navigating to each product individually.
-
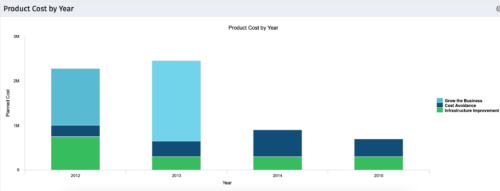 The Product Cost by Year portlet displays active product cost by year, summarized by goal. The product cost is pulled from the product’s planned cost and is displayed by year, with colors representing each product goal. This portlet provides management with a quick overview of all product costs without having to navigate to each product individually.
 -
The Product Cost by Year portlet displays active product cost by year, summarized by goal. The product cost is pulled from the product’s planned cost and is displayed by year, with colors representing each product goal. This portlet provides management with a quick overview of all product costs without having to navigate to each product individually.


Copyright 2023 • Rego Consulting Corporation • Privacy Policy