-
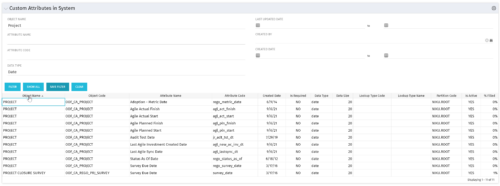 The Custom Attributes in System portlet displays all of the custom attributes present in the system and the lookup (if applicable) associated with each. This portlet is useful finding a custom attribute on an object, auditing, or for documentation purposes. The user may narrow the results by object, data type, and last updated date.
 -
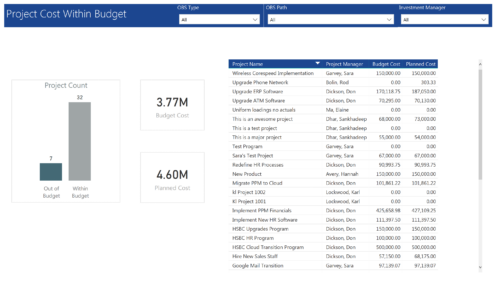 Project Cost within Budget report displays count of projects that are within or exceeding budget in the form of a bar chart. It also displays Total budget cost and Planned cost. User can further drill down the details to investment level. You can further narrow your search by OBS Type & Path and Investment Manager.
 -
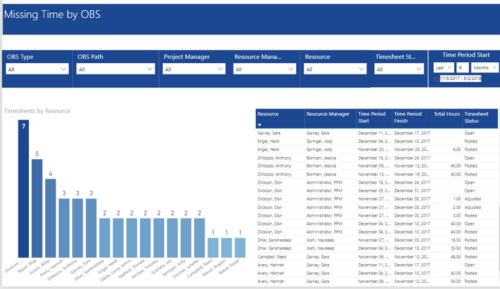 Missing Time by OBS report displays Resource whose timesheets are missed. There is Clustered Column Chart which displays Timesheets count by Resource. Also, there is table view of Resource, Resource Manager, Time Period Start and Finish Dates, Total Hours and Timesheet status. User can narrow their search by OBS Type & Path and Project Manager, Resource Manager, Resource, Timesheet Status and Time Period Start Date (Relative or Specific Date Range).
 -
 This training document is a Rego Consulting Quick Reference Guide to assist with creation of Roadmaps and the adding of investments to Roadmaps in Clarity’s Modern User Experience. This doc references version 16.3 views. Document provides detail on the Import from PPM function, Import from CSV as well as manual creation of Roadmap items. Detail is provided on how to create a manual Roadmap item from the Grid View, Timeline View or Board View. Instructions are also provided on how to synchronize a Roadmap.
 -
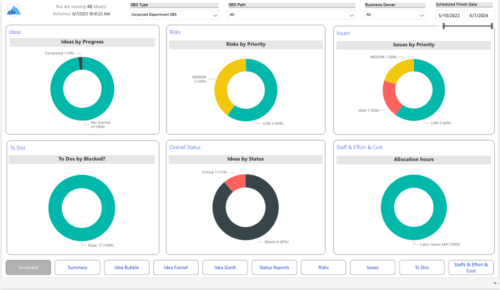 Master your pipeline as you prioritize, visualize, and analyze ideas, assess their feasibility, and track progress from inception to execution. Report Views include: • Idea Bubble • Idea Details • Idea Funnel • Idea Gantt • Idea Overview • Idea Staff and Effort • Idea Status • Idea To Dos Demo Video - https://www.youtube.com/watch?v=xPSxOlrqEq8&list=PLXJ5ktuWV0jiS9CvBpHvBIwpKPmA9uvwK&index=3 The main .rpt file will access data through the Data Warehouse. For clients on Rego’s AWS hosting, we have versions that work with Oracle and Postgres DB and access the live database, if the Rego Odata connector is being used.
 -
 Do you want to understand the OOTB configuration and functionality of financial management? In this class, we will review the OOTB objects, views, views, and functions of financial plans, rates, and other related areas. We will cover both newUX gaps from classic. We will discuss best practices.
 -
 This training document is a Rego Consulting Quick Reference Guide to assist with the creation of Budget Plans in Clarity’s Modern User Experience. The document reviews submission of a cost plan for approval, approving or rejecting submitted budgets and Budget Plan facts.
 -
 This training document is a Rego Consulting Quick Reference Guide to assist with the process of converting an idea to a project in Clarity’s Modern User Experience.
 -
 A Quick Reference Guide to assist in the creation and management of Status Reports in Clarity’s Modern UX. Reviews accessing the project details from the grid or tile view, creation of a new status report, existing status reports in Classic, updating status reports, customizing project status, and the project status list view.
 -
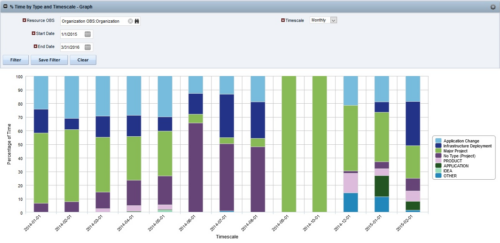
 The Percent Time by Type and Timescale - Graph portlet shows a breakout of time by timescale for resources the logged in user has view rights to. This portlet gives the Clarity user the ability to show the amount of hours spent on each project type by week, month, quarter and year. Using this portlet, the Clarity user can get an overview of all hours in a time period or use the filter to search for a specific dataset (as required). The portlet provides a filter for OBS and date ranges.
 -
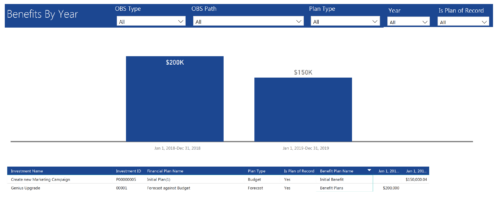 Benefits by year report provide the project manager a single place to view Benefit plan (Forecast /Budgeted) and its associated benefit for various years across multiple projects. Information is displayed in a bar graph and user can further drill down the details to investment level. Project Managers can use this report to analyze if the projects are giving intended benefits and take appropriate decisions accordingly. User can further narrow their search by OBS Type & Path, Plan Type (Budget/Forecast), Year and Is Plan of Record?.
 -
 Are your project teams using SharePoint effectively and getting the most value out of it? Is document management a daily struggle? Learn how to use SharePoint with Clarity in a more seamless way to improve collaboration and team productivity.


Copyright 2023 • Rego Consulting Corporation • Privacy Policy