-
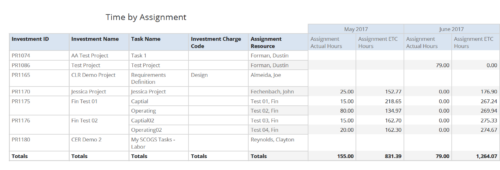 Time by Assignment report displays time logged to assignments and its associated actuals on monthly basis for all filtered investments. It also displays total ETC and Actual hours associated with an assignment. User can further narrow their search by OBS Type & Path, Investment Type, Investment Charge Code, Investment Name, Task Name, Resource Name, Assignment Start Date and Assignment Finish Date. User can use exact dates or relative dates for Assignment Start and Finish Dates filter parameters.
 -
 ** No Download - Do not Add to Cart ** As Clarity's Modern UX continues to evolve with each release, so has the transition conversation among Clarity Product Owners and Administrators. It's no longer a question of "if" and "when;" the question is, how? In this webinar, we'll explore some best practices that enable a successful shift from Classic to Modern. Through a collaborative discussion of overarching strategies to a step-by-step checklist, this session is designed to help you quickly position your users to take advantage of Clarity's latest and greatest capabilities. Nothing to Download - See Link below. http://info.regoconsulting.com/when-to-move-to-modernux-aug-2020
 -
 This paper will help you launch a PMO—or facelift the one you’ve got—by making sure your PMO charter can handle strategic heavy lifting. It covers everything from getting stakeholder buy-in to achieving successful adoption throughout your organization. This White Paper is downloaded from the Rego Consulting site. You will be asked to provide your email address and current ppm tool. - http://info.regoconsulting.com/launch-pmo-whitepaper ** No Download - Do not Add to Cart **
 -
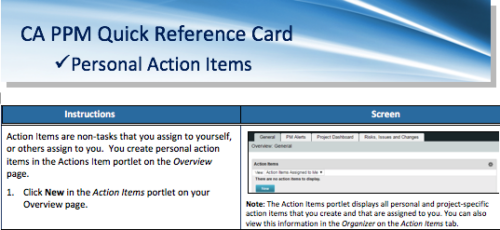 A quick reference card to assist you in making Action Items in CA PPM. Action Items are non-tasks that you assign to yourself, or others assign to you. You create personal action items in the Actions Item portlet on the Overview page.
 -
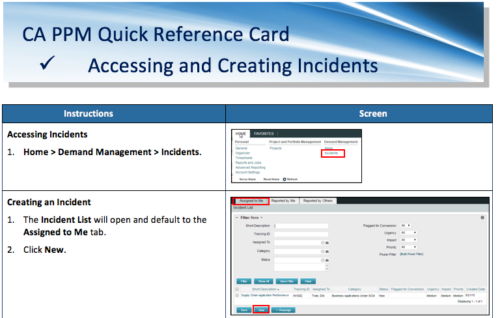 A Quick Reference Card to assist in the accessing and creation of Incidents in CA PPM. Incidents can be found by going to Home, then Demand Management to the Incident list menu item.
 -
 This video reviews how to return and approve Clarity timesheets as a Project or Resource Manager.
 -
 This video covers the process of adding tasks to the timesheet using Populate and Add Task, using the timesheet notes functionality, entering timesheet data, updating ETC via the timesheet, and submitting the timesheet.
 -
 The Manage Risk Categories document provides the steps needed to modify the current system-defined list of values for the Risk categories
 -
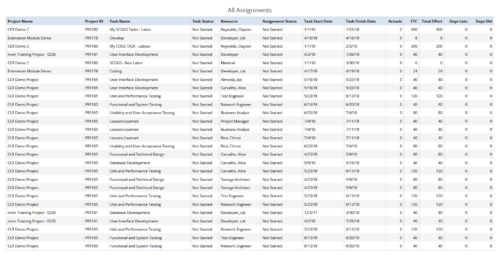 All Assignments report provides the Managers a single place to view all the assignments associated with a project(s). User can view only the investments that he has access to. This report also displays ETC, Actuals, Total Effort, Days Old (Elapsed days between Task Finish Date and Today's Date), Days Late (Elapsed days between Task Finish date and Task Baseline Finish date) associated with the task. You can further narrow your search by OBS Type & Path, Resource Name , Project Manager, Project Name, Project ID, Is project Active?, Assignment Start Date, Assignment Finish Date, Assignment Status and Task Status.
 -
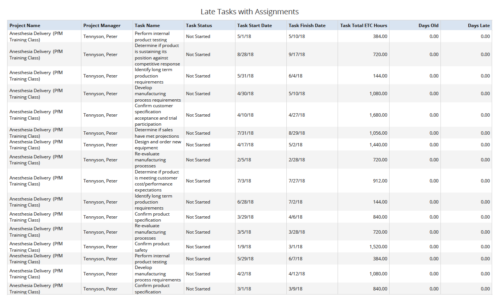 Late Tasks with Assignments report displays the list of all Tasks (with their Total ETC Hours) that are not closed but are past their finish date or past their baseline finish date. The report provides Project Manager the ability to view and track late tasks across multiple projects without going into each project individually. This report displays Project Name, Project Manager, Task Name, Task Status, Task Start Date, Task Finish Date, Days Old (Elapsed days between Task Finish Date and Today's Date), Days Late (Elapsed days between Task Finish date and Task Baseline Finish date). User can further narrow their search by Task Name, Task Status, Project ID, Project Name, Project Manager, Is Milestone?, Is late?, Task Start Date, Task Finish Date and Is Template?. User can use exact dates or relative dates for Task Start Date and Task Finish Date filter parameters.
 -
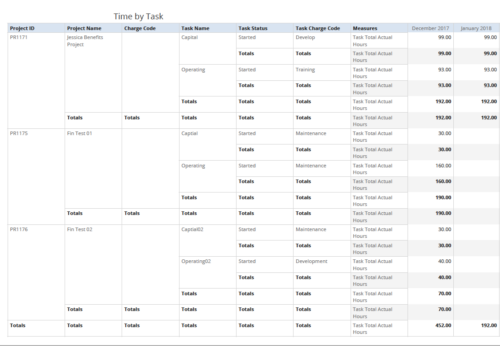 Time by Task report displays monthly time logged to Tasks for all filtered investments. It also displays total Actual hours associated with a task. User can further narrow their search by OBS Type & Path, Charge Code, Project Name, Task Name, Task Charge Code, Task Status and Month End Date. User can use exact dates or relative dates for Month End Date filter parameters.
 -
 Learn the basics of creating Jaspersoft studio reports. This session will walk through basic features and introduce report development utilizing the basic report capabilities of Jaspersoft Studio such as Text Fields, Frames, Static Text, Breaks, Lines and Common Page Information Components, Grouping/Sorting, Status Indicators, Dynamic Images, Input Controls, and Basic Charting.


Copyright 2023 • Rego Consulting Corporation • Privacy Policy