-
 This portlet displays the % allocation of resources to projects. The portlet shows if the resource is allocated to the projects as an individual resource or as part of an Agile team, in which case it will display the resource % allocation to the team and what that will represent in terms of % allocation to the project. The Total Allocation % display the allocation of the resource to all investments is allocated to. Remaining Capacity and Over/Under columns will help identify the resources that still have availability and the ones that are over allocated.
 -
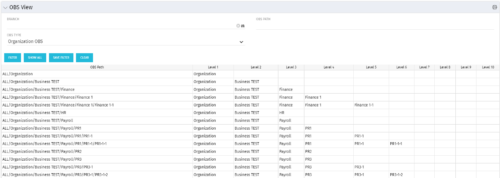 This grid portlet shows the OBS name and ID along with the associated hierarchy, both as an aggregated view along with each of the levels broken out. The table below describes the available filter fields in the portlet.
Column Label Description Branch Branch of the OBS OBS Type OBS to use OBS Path Path of the OBS -

This portlet displays the monthly allocation per resource. The PM can view by the RM or the resource to get the data for monthly resource allocations. The table below describes the available filter fields in the portlet. Column Label Description Work Effort Manager Manager of the Investment the Work Effort is on Work Effort Active Active status of the Investment the Work Effort is on Resource Resource’s Name Internal Resource ID Resource’s ID Zero Allocation Show Allocations that equal zero Open for Time Entry Is the Resource Open for Time Entry Resource Active Resource’s Active status Role Resource’s Primary Role OBS Unit Resource’s OBS Start Allocation Start Time to filter by End Allocation Finish time to filter by -
 This Portlet produces a Grid View of Resources using total Resource Allocation from each Project’s Team / Staff, per month; output is expressed as a %. Users can specify which Resource OBS to use as a Filter (unit and descendants is assumed) as well as a Start/End Date.
 -
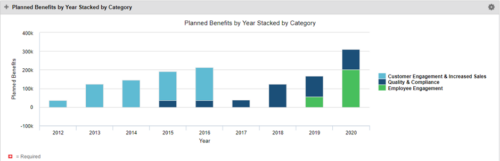 This Portlet starts by pulling Active Investments from a Classic UI Portfolio. It then looks for the Cost Plan of Record and its’ linked Benefit Plan. It then aggregates the Planned Benefit and groups it by Category, then presents a stacked bar chart.
 -
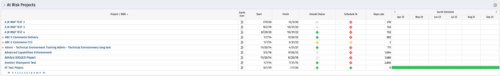 Part of the Business Transformation collection, this bar-chart portlet displays investments and (if exists) any child investments, which are at risk with regard to the schedule of the investments.
 -
 Funnel Chart displays aggregated counts of Ideas by “Idea Progress”, a custom attribute. Chart shows Idea Progress names in legend, and count total is available as a mouse-over. No filters available on this portlet.
 -
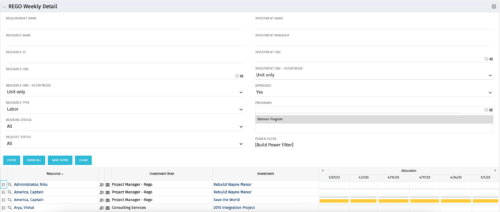 This is the same portlet as the out of the box Weekly Detail with an additional filter element for Program (multiple select). Portlet displays resource allocations graphically for each project in the specified program(s), for the next six weekly periods. Portlet filterable by numerous project, resource, and assignment attributes. Graphical representation shows Resource Availability Threshold and Allocation in hours, as a mouse-over.
 -
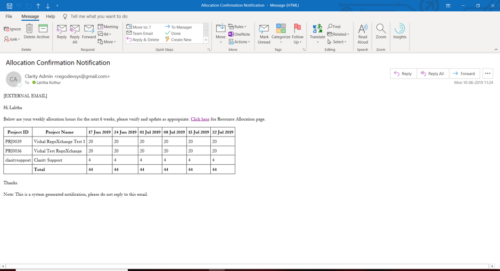 A Process run via Execute a Process job; sends an email to active resources, containing a facsimile of their Resource Allocation Detail page. It shows the next six weeks of allocations by investment, with a column total. The email also contains a click here link to this page in CA PPM, to enable editing of the data, as appropriate.
 -
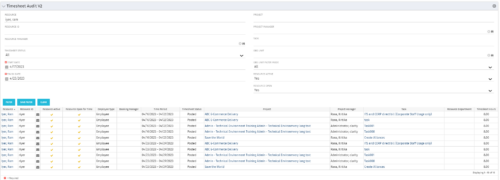 The Timesheet Audit portlet displays timesheet information in order to perform an audit. The only required data needed to search the portlet is start and finish date. Additionally, you may narrow the results by filtering by resource, resource ID, OBS Unit, resource manager, timesheet status, project, and task. The portlet provides reporting on the following:
- Resource
- Resource ID
- Email Icon of Resource (So the reviewer can quickly email the Resource)
- Resource is Active
- Resource Open for Time
- Time Period (Start and Finish Dates)
- Timesheet Status
- Is Adjustment (If the timesheet is adjusted)
- Timesheet Modified Date
- Timesheet Posted Date
- Timesheet Submitted By
- Timesheet Approved By
- Project
- Task
- Proposed ETC Hours
- Pending Actual Hours
- Total Actual Hours
-
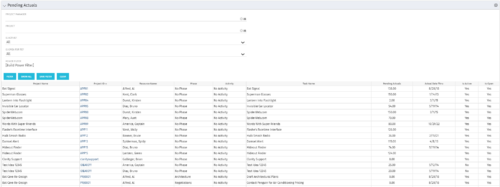 The Pending Actuals portlet displays pending actuals for resources by task. This portlet allows the user to filter on Project, Project Manager, Is Active and Is Open for Time Entry. This portlet provides Resource Managers and Project Managers a simple way to analyse which actuals have been submitted but not posted on specific tasks, as well as the aggregate pending hour total. Note: the information displayed is dependent on what the user has security rights to view.
 -
 The Changing Application Logo and Title tech trick provides an overview of how to change the logo and title within the application. This allows administrators to rebrand Clarity to their own logo and title. By customizing the logo, employees may be more encouraged to take ownership of the tool.


Copyright 2023 • Rego Consulting Corporation • Privacy Policy