-
 The Communications Portlet - Simple portlet provides a simple mechanism to communicate with Clarity users. The content of the porlet can be edited easily through the Portlet administration screens within Clarity. This is a very beneficial method of delivering messages to your Clarity users all at the same time.
 -
 This video describes the process review and approve/reject Pending Actuals and ETCs within OWB. The video is available in both .m4v and .wmv formats.
 -
 This video describes the process to baseline a project using OWB. The video is available in both .m4v and .wmv formats.
 -
 This video describes the process to Autoschedule a project using OWB. The video is available in both .m4v and .wmv formats.
 -
 This video describes the process either a Start or Finish date on a project in OWB. The date (start or finish) will determine the point from which all tasks in the project are then scheduled. The video is available in both .m4v and .wmv formats.
 -
 This video describes the process of transferring assignments from one resource to another resource of the same type (e.g., labor to labor, equipment to equipment) using the Transfer Assignments Wizard in OWB. The video is available in both .m4v and .wmv formats.
 -
 This video describes the process to assign resources to tasks within OWB. The video is available in both .m4v and .wmv formats.
 -
 This video describes how to create and work with task dependencies within Open WorkBench. The video is available in both .m4v and .wmv formats.
 -
 This video describes the process of creating new tasks and working with the Work Breakdown Structure (WBS) within Open WorkBench. The video is available in both .m4v and .wmv formats.
 -
 This video provides an overview of utilizing the various views available within Open WorkBench. The video is available in both .m4v and .wmv formats.
 -
 This document will walk the user through step by step on how to utilize the new pages functionality in the modern UX to link to the classic dashboard without showing the classic UI menus.
 -
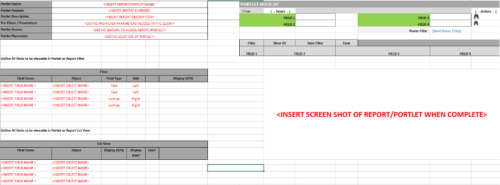 This Excel document provides a template for mocking up and validating portlet requirements. The template is important to use to help end users visualize the final output of a portlet. Template Defines:
- Portlet Name
- Portlet Purpose
- Portlet Description
- Portlet Security
- Portlet Placement
- Portlet Filter Fields/Layout
- Portlet Grid Fields/Layout


Copyright 2023 • Rego Consulting Corporation • Privacy Policy