-
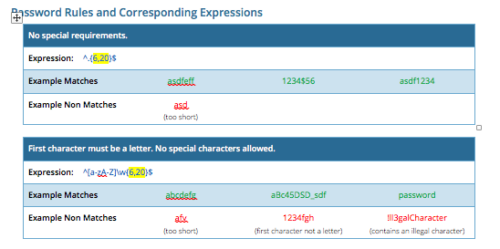 CA PPM allows you to create custom password rules using regex. This document lists expressions for a variety of password rule scenarios. Passwords with length limits default to between 6 and 20 characters. You can change this by editing the highlighted section of the expression. The number before the comma is the minimum password length, and the number after the comma is the maximum password length.
 -
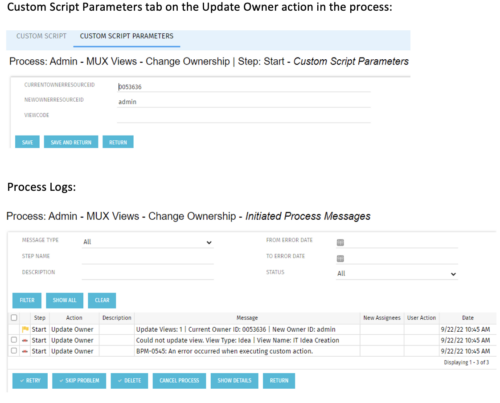 This is a standalone process that can be run by an admin to change the ownership of MUX views from a specified user to another specified user. The process contains a single custom script, which has the following parameters that must be updated prior to running the process:
- currentOwnerId (required): Resource ID for the current Owner (unique_name from srm_resources table)
- newOwnerId (required): Resource ID for the new Owner (unique_name from srm_resources table)
- viewCode (optional): Code for the specific view to update - leave blank if you want to transfer ownership for all views (odf_ui_views.code)
- Navigate to the process called Admin - MUX Views - Change Ownership.
- Navigate to the Start Step tab, Click on the Update Owner action, and click the Custom Script Parameters tab.
- Enter the Resource ID for the current view owner into the currentOwnerId parameter.
- Enter the Resource ID for the new owner into the newOwnerId parameter.
- If you want to update a specific view only, enter that in the viewCode parameter.
- Run the process via Organizer in Classic.
-
 A Quick Reference Guide with tips on creating a Dashboard in Jaspersoft. The document walks through the steps and uses screenshots to show the process.
 -
 A Quick Reference Guide to assist in managing a Custom Investment in Clarity’s Modern UX. Reviews accessing the Custom Investment Link and navigating the tabs.
 -
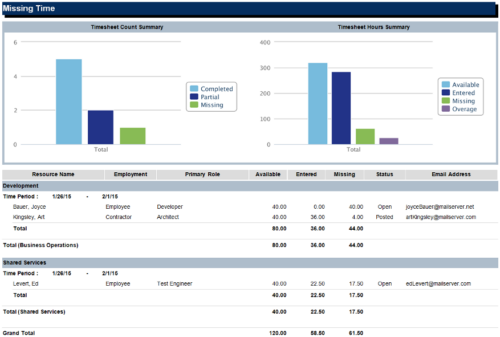 The Missing Time report is a transaction based Jaspersoft report that does not require the Load Jaspersoft Datawarehouse job to be run. The report will pull real-time data from the transaction tables in Clarity. This report can be run from either the Advanced Reporting or Reports and Jobs area within Clarity. The Missing Time report displays resource available hours, timesheet hours entered, and timesheet hours missing by resource and time period. The report can be grouped by resource manager or OBS level. The report also has an option to calculate missing time based on timesheet status or resource availability. The charts include a summary of timesheets across the periods included in the report. The Timesheet Count Summary displays the number of timesheets that are completed, partially completed, or missing for the time periods. The Timesheet Hours Summary displays the number of hours grouped by resource availability, timesheets entered, timesheets missing, and overage.
 -
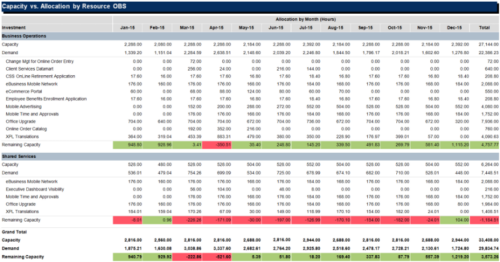
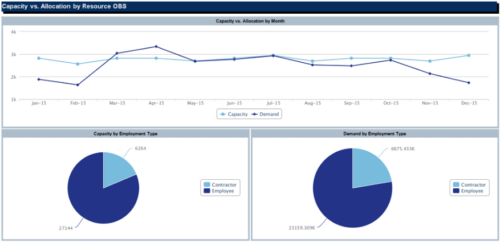 The Capacity vs Allocation by OBS report is a transaction based Jaspersoft report that does not require the Load Jaspersoft Datawarehouse job to be run. The report will pull real-time data from the transaction tables in Clarity. This report can be run from either the Advanced Reporting or Reports and Jobs area within Clarity. The Capacity vs. Allocation by OBS report displays resource capacity and demand across investments. The report can be grouped by any OBS level, providing visibility into resources at any level of the organization. The report displays amounts by week or month, and in total. The amounts can be displayed as hours or FTEs.
 -
 Over time notifications can build up in the CA PPM system and should be purged, so as not to hinder performance. The SQL statements mentioned in the tech doc can be implemented within a process in CA PPM to either purge notifications on an ongoing basis or remove all of them at once.
 -
 This portlet pulls back the Availability and Allocation totals by Role between a user-specified Start and Finish Date, then the user can drilldown to look at the information for Applications. The Time Period filter allows for comparing these values across different timeframes (monthly, weekly, quarterly, annual) as desired. Other filters allow for looking at Active or Inactive Roles (or both) and including Active or Inactive Projects (or both) in the totals.
 -
 This video describes the process to Autoschedule a project using OWB. The video is available in both .m4v and .wmv formats.
 -
 This video describes the process to assign resources to tasks within OWB. The video is available in both .m4v and .wmv formats.
 -
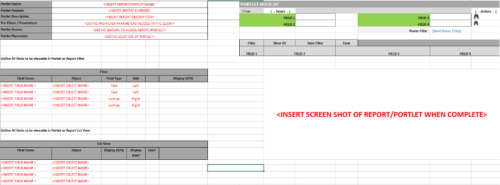 This Excel document provides a template for mocking up and validating portlet requirements. The template is important to use to help end users visualize the final output of a portlet. Template Defines:
- Portlet Name
- Portlet Purpose
- Portlet Description
- Portlet Security
- Portlet Placement
- Portlet Filter Fields/Layout
- Portlet Grid Fields/Layout
-
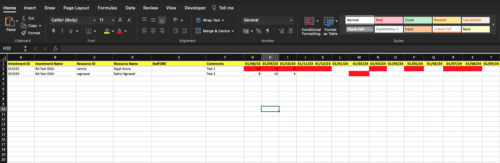
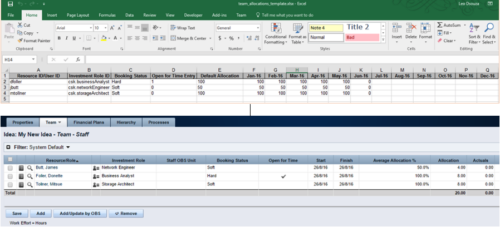 The idea allocation uploader allows you to import in allocations from an external Excel spreadsheet. Populate an Excel template with required fields then import them directly from the Clarity UI. Once imported you’ll see the allocations right on the Team tab of the Idea.


Copyright 2023 • Rego Consulting Corporation • Privacy Policy