-
 We invite you to participate in a collaborative conversation focused on leveraging the Apptio tool to manage non-IT expenditures such as shared services, HR, finance, risk, legal, and M&A. Exchange experiences, explore real-world scenarios, and gain insights into best practices for cost allocation and chargeback in these critical business areas using Apptio. Don't miss this opportunity to broaden your understanding of EBM use cases with the powerful capabilities of the Apptio tool.
 -
 Has your organization made significant investments in technology solutions without seeing precise results? Do you have the right capabilities yet lack an interconnected, end-to-end solution? Come to this session to learn more about the importance of a living strategic roadmap and how Rego's Digital Ecosystem Assessment program can help. This session will review the key elements needed to create an effective roadmap that can drive increased maturity and excitement within your organization, and how that roadmap can help optimize your digital ecosystem.
 -
 A presentation slide deck from Rego University 2022. The course discusses factors that differentiate Requirements.
- Introduction (What & Why)
- Definition & Uses of Requirements
- The Challenges in Requirements in Software
- Revisit the Agile Taxonomy
- The Transition from Traditional to Agile
- Rethink the Agile Portfolio
- Guidelines and Characteristic of Taxonomy
-
 Does project and idea estimation take too long and lack visibility? This class will address one of the most common pain points within organizations: how to involve the right people within a timely project estimate. Learn some Rego best practices for defining, calculating, and modifying idea and project estimates, so you can increase throughput and ROI.
 -
 Course Description: No matter how hard we try many organizations cannot pry Excel out of the hands of project and resource managers. In this class, we will explore possibilities that embrace Excel as a great data entry tool. We will show useful case studies on quick Excel integrations deployed for customers.
 -
 ** No Download - Do not Add to Cart ** The Excel Data Manager for Clarity PPM Would you like to process your Clarity PPM data in Microsoft Excel? - Extract - Edit - Validate - Send large datasets It's simple to do using Rego's recently-acquired Excel Data Manager for Clarity PPM. Check out a demo of the solution here. Follow this url to register to view the recorded webinar - http://info.regoconsulting.com/excel-data-mgmt
 -
 The Executive Dashboard portlet displays information regarding projects the user has security rights to view. It provides a one-stop place for the PMO or management to view all critical information about projects. The portlet not only displays status indicators as well as dates for late items, variances and days late, but also displays the project status fields from the Status Report sub-object.
 -
 The Executive Dashboard portlet displays information regarding projects the user has security rights to view. It provides a one-stop place for the PMO or management to view all critical information about projects. The portlet not only displays status indicators as well as dates for late items, variances and days late, but also displays the project status fields from the Status Report sub-object.
 -
 The Executive Dashboard portlet displays information regarding projects the user has security rights to view. It provides a one-stop place for the PMO or management to view all critical information about projects. The portlet not only displays status indicators as well as dates for late items, variances and days late, but also displays the project status fields from the Status Report sub-object.
 -
 Course description: “What can leaders do after a CA PPM deployment to ensure continued success of the product? This session will discuss how sponsors can drive compliance within the organization through continued involvement. Strong sponsorship is the key to long term success.” Download file is the slide deck used during the presentation.
 -
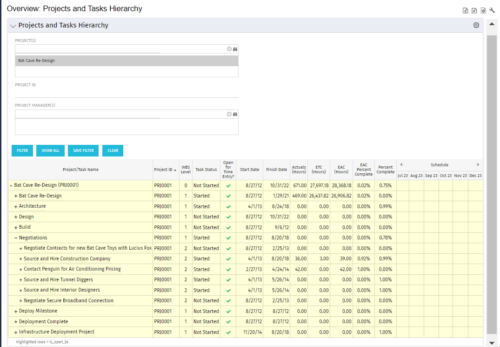
 This document provides an overview of how hierarchical portlets can be exported to MS Excel. The code of a sample hierarchical portlet is explained. The included sample portlet shows a list of projects and the tasks under each project along with actual and assignment hours. The portlet can also be filtered by project and project manager.


