| Column Label | Description |
| Process Name | Name of the process |
| Start Date | Start date of the process’s last ran date |
| End Date | End date of the process’s last ran date |
| Description | Description of the process |
| Process ID | ID of the process |
-
 For each process, the Process Run Metrics portlet shows the Process Name, Process Code, Description, # Running, # Completed, # Errored, and Last Run Date. This portlet is ideal for system administrators and support staff needing to monitor the health of the environment. Viewers of this portlet can get a sense of the complexity & health of the environment with the # of processes running and visibility into processes that errored out. The table below describes the available filter fields in the portlet.
 -
 For each process, the Process Run Metrics portlet shows the Process Name, Process Code, Description, # Running, # Completed, # Errored, and Last Run Date. This portlet is ideal for system administrators and support staff needing to monitor the health of the environment. Viewers of this portlet can get a sense of the complexity & health of the environment with the # of processes running and visibility into processes that errored out. The table below describes the available filter fields in the portlet.
Column Label Description Process Name Name of the process Start Date Start date of the process’s last ran date End Date End date of the process’s last ran date Description Description of the process Process ID ID of the process -
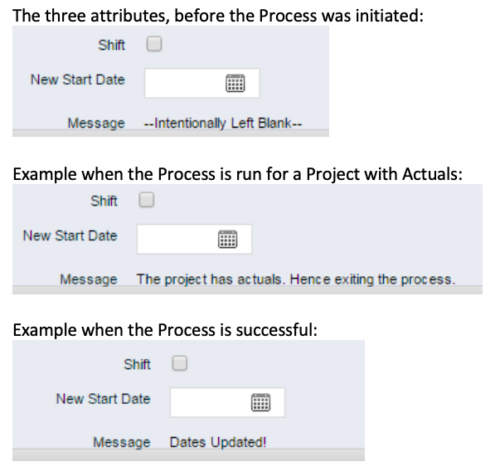
 This process, Shift Project Dates, helps Project Managers change an entire Project / Idea’s dates to a new start date. Once the three attributes are added to the Idea /Project Views, the PM can trigger the process by entering a date in the New Start Date field and checking the Shift checkbox. The process runs automatically on Save. The process calculates the date difference between the original Start Date and New Start Date then shifts all Allocation, Task, and Assignment dates by the calculated difference. For example, if a Project is set to begin on January 1st and needs to be pushed to a February 1st start date, the process first determines that there are 31 days between the original start date and the new date. Next the process increases the start date for each Task, Allocation and Assignment by 31 days. NOTE: The process will shift Allocation dates regardless of resource restrictions such as a Termination Date or non-working time as marked on their calendar. The Team page will reflect the Available Start and Finish as shifted by the process, but the Allocation hours and % will take unavailable time into account. For example, if a shift process sets the start date for a resource to be after their date of termination the dates will change by the date difference, but the Allocation hours will correctly be calculated as zero.
 -
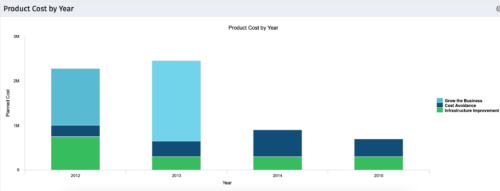
 The Product Cost by Year portlet displays active product cost by year, summarized by goal. The product cost is pulled from the product’s planned cost and is displayed by year, with colors representing each product goal. This portlet provides management with a quick overview of all product costs without having to navigate to each product individually.
 -
 The Product Cost by Year portlet displays active product cost by year, summarized by goal. The product cost is pulled from the product’s planned cost and is displayed by year, with colors representing each product goal. This portlet provides management with a quick overview of all product costs without having to navigate to each product individually.
 -
 Today, most high-performing organizations recognize that moving from project-funding to product-funding is necessary for achieving business agility. What doesn't exist in the industry is guidance on how to support the transition from a tooling perspective. In this session, Rego Expert Guide Robert Sirard presents a practical and tactical approach to using Clarity's PPM software and Rally's Agile software together to plan, track, monitor, and deliver products. At Rego, we realize that not everything needs to be done in an Agile manner, so Robert will discuss how this approach also supports a mix of traditional and Agile investments. ** No Download - Do not Add to Cart ** There is no download for this content. Follow the link to view - http://info.regoconsulting.com/product-funding-clarity-rally-may-2021
 -
 The Program Dashboard Sub-Project Change Requests portlet gives the ability to view all change requests of sub-projects of a program. The portlet will pull the "id" from the page it is placed on, so this portlet is usually placed on the dashboard tab. The portlet sorts the issues first by status, in descending order, and then by target date. It displays the sub-project name, change request name, owner, status, target date, approved by, and the priority.
 -
 The Program Dashboard Sub-Project Change Requests portlet gives the ability to view all change requests of sub-projects of a program. The portlet will pull the "id" from the page it is placed on, so this portlet is usually placed on the dashboard tab. The portlet sorts the issues first by status, in descending order, and then by target date. It displays the sub-project name, change request name, owner, status, target date, approved by, and the priority.
 -
 The Program Dashboard Sub-Project Change Requests portlet gives the ability to view all change requests of sub-projects of a program. The portlet will pull the "id" from the page it is placed on, so this portlet is usually placed on the dashboard tab. The portlet sorts the issues first by status, in descending order, and then by target date. It displays the sub-project name, change request name, owner, status, target date, approved by, and the priority.
 -
 The Program Dashboard Sub-Project Open Issues portlet gives the ability to view issues on sub-projects of a program that are not closed or resolved. The portlet will pull the "id" from the page it is placed on, so this portlet is usually placed on the dashboard tab. The portlet sorts the issues first by priority and then by target date. It displays the sub-project name, issue name, owner, target date, status and priority.
 -
 The Program Dashboard Sub-Project Open Issues portlet gives the ability to view issues on sub-projects of a program that are not closed or resolved. The portlet will pull the "id" from the page it is placed on, so this portlet is usually placed on the dashboard tab. The portlet sorts the issues first by priority and then by target date. It displays the sub-project name, issue name, owner, target date, status and priority.
 -
 The Program Dashboard Sub-Project Open Issues portlet gives the ability to view issues on sub-projects of a program that are not closed or resolved. The portlet will pull the "id" from the page it is placed on, so this portlet is usually placed on the dashboard tab. The portlet sorts the issues first by priority and then by target date. It displays the sub-project name, issue name, owner, target date, status and priority.
 -
 The Program Dashboard Sub Project Action Items portlet display Action Items of Sub Projects in a Program. The portlet will pull the "Action Items" from all the sub projects in the Program, and this information is placed on the Dashboard tab. This portlet displays each Project, name of the Action Item as mentioned in the Subject, and the resource who Created this Action Item. Assigned To field will display the resource to whom the Action Item has been Assigned. Due Date mentions the date the Action Item will be completed and the Priority level of the Action Item is a stoplight showing red, yellow and green for the different levels of priority. The table below describes the available columns in the portlet. The first 6 are configured in the default view:
Column Label Description Project Name of the Project Subject Defines the name for Action Item Created By Resource who created the Action Item Assigned To Resource who the Action Item is Assigned to Due Date Date the Action Item is due for completion Prty Specifies the priority level of the Action Item Action Item ID Internal ID used by the query Created By ID Internal ID used by the query Created Date Date the Action Item was created Days Open No. of days the Status of Action Item has remained opened since it was created Priority Name Based on high, medium, or low priority with corresponding red, yellow, or green stoplights Project DB ID Internal ID used by the query Project ID Unique ID of the Project within Clarity Project Manager Project Manager


