-
 The Dashboard: Project Information portlet gives a set of high-level information about the project. The portlet will pull the "id" from the page it is placed on, so this portlet is usually placed on the project dashboard tab. The portlet displays the name, project ID, project manager, description, start date, finish date, baseline start, and baseline finish.
 -
The Dashboard: Project Information portlet gives a set of high-level information about the project. The portlet will pull the "id" from the page it is placed on, so this portlet is usually placed on the project dashboard tab. The portlet displays the name, project ID, project manager, description, start date, finish date, baseline start, and baseline finish.
-
 The Dashboard: Project Status Single-line portlet gives an overview of the project overall status as well as the status indicators on the "current" status report object. The portlet will pull the "id" from the page it is placed on, so this portlet is usually placed on the project dashboard tab. This portlet displays the report date, symbols relating to the overall status, scope, schedule, cost/effort, and the overall explanation across a single line in the portlet.
 -
The Dashboard: Project Status Single-line portlet gives an overview of the project overall status as well as the status indicators on the "current" status report object. The portlet will pull the "id" from the page it is placed on, so this portlet is usually placed on the project dashboard tab. This portlet displays the report date, symbols relating to the overall status, scope, schedule, cost/effort, and the overall explanation across a single line in the portlet.
-
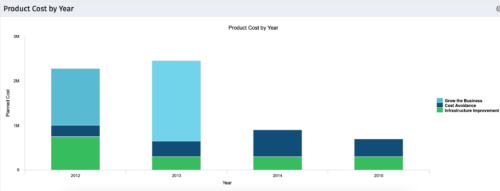 The Product Cost by Year portlet displays active product cost by year, summarized by goal. The product cost is pulled from the product’s planned cost and is displayed by year, with colors representing each product goal. This portlet provides management with a quick overview of all product costs without having to navigate to each product individually.
 -
The Product Cost by Year portlet displays active product cost by year, summarized by goal. The product cost is pulled from the product’s planned cost and is displayed by year, with colors representing each product goal. This portlet provides management with a quick overview of all product costs without having to navigate to each product individually.
-
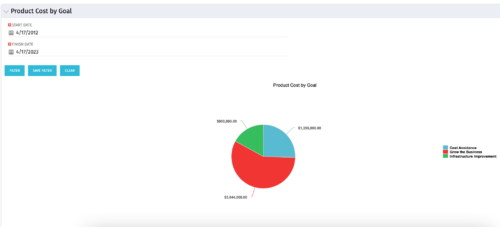 The Product Cost by Goal portlet displays the planned cost of all active products within a timeframe, summarized by goal in a pie chart. This portlet provides management with a quick overview of cost by goal within a year without navigating to each product individually.
 -
The Product Cost by Goal portlet displays the planned cost of all active products within a timeframe, summarized by goal in a pie chart. This portlet provides management with a quick overview of cost by goal within a year without navigating to each product individually.
-
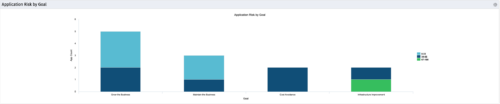 The Application Risk by Goal portlet displays a count of active applications by goal with a sub-count by risk. The graph is color-coded by risk rating:
- 1-33 – Green
- 34-66 – Yellow
- 67-100 – Red
-
The Application Risk by Goal portlet displays a count of active applications by goal with a sub-count by risk. The graph is color-coded by risk rating:
- 1-33 – Green
- 34-66 – Yellow
- 67-100 – Red
-
The Application Risk by Goal portlet displays a count of active applications by goal with a sub-count by risk. The graph is color-coded by risk rating:
- 1-33 – Green
- 34-66 – Yellow
- 67-100 – Red


Copyright 2023 • Rego Consulting Corporation • Privacy Policy