- Configuration
- A master object called Allocation Upload Files will be created. The object will contain a required attachment field on the create page that will receive the Project Allocation Upload MS Excel file.
- A new sub-object called Allocation Upload Records will be created. This object will contain the fields necessary to receive the data rows from the Project Allocation Upload template.
- The master object will store the file level data while the sub-object will store the rows that belong to the file.
- Users must be granted security to view and edit the master and sub-objects in order to run the upload process.
- Project Allocation Upload Template
- The Project Allocation Upload template must remain static. Any changes other than creating additional time periods or additional rows will cause the process to error.
- Only the Project Allocation Upload template can be used to load records to the new objects.
- The Project Allocation Upload will only accept months across the x-axis in the format DD/MM/YYYY. The month headers must appear in the first row of the template and contain the first day of the month.
- The template must be distributed to the users that will be using the upload functionality.
- Users will be required to enter an Investment ID and Resource ID so the process can correctly identify investments and resources to upload the allocation hours against.
- A Staff OBS is not required but can be populated by users to have the data uploaded into CA PPM.
- The owner of the Project Allocation Upload template is responsible for providing users a valid list of Staff OBS Units.
- Investments will not be created through the interface. As such a valid Investment ID must be provided.
- Resources can be added to the investment team through the interface. If a valid Resource ID is provided the resource’s allocation will be updated if the resource already exists on the investment. If the resource does not already exist on the investment the resource will be added to the team along with the allocation hours.
- The Project Allocation Upload template will accept hours, not allocation percentages. Because CA PPM stores allocations as percentages of a resource’s availability the upload process must convert hours to a percentage. As a result small rounding errors may occur in the neighborhood of .01 hours per month.
- Resources cannot be removed from investment teams through the interface.
- The Project Allocation Upload template will support allocation uploads to different instances of the same role on the same investment as long as different Staff OBS units are provided.
- If multiple instances of the same role are assigned to the investment with the same Staff OBS the process will not know which instance of the role to upload the hours to. In these cases the process will consider these records as invalid. The PM will need to manually remove one of the instances or upload the hours manually..
- If multiple instances of the same role with the same Staff OBS unit are assigned to the same investment in the upload template the monthly hours will be totaled by investment, by role, by Staff OBS.
- The allocation template will follow the format in the screenshot area.
- Process
- To initiate the Allocation Interface a user will create a new Allocation Upload File instance, attach the Project Allocation Upload Template, and save the record. The file attachment field is an “enter-once” field, meaning that once a value has been set it cannot be changed. If a user wishes to upload another field they will create a new record.
- After the file has been attached the user will be presented with two check box fields, one to Validate and one to Validate and Upload. Checking either or both options will initiate the process.
- The process will first determine if any sub-object instances exist for the file. In other words, do any records already exist in the Allocation Upload Records sub-object pertaining to the newly uploaded file. If there are no records in the sub-object the process will use the uploaded file and read its contents into the sub-object. If errors are encountered during the file read they will be written to the process console, the process will throw an error, and end.
- Next, records will be validated. Only the sub-object instances that belong to the master object will be validated. Records belonging to other master object instances will not be validated or processed. All records in a status of Ready for Processing, Failed Validation, or Xog Load Error will be validated. Records will fail validation if an investment is not found corresponding to the investment ID provided, a resource is not found corresponding to the resource ID provided, or the date provided is not valid, or a provided Staff OBS does not yield a match. Records that fail validation will be flagged as invalid along with a description as to why they failed validation. Records that pass validation will be flagged as Ready for Processing and locked. The sub-object instances can be exported to excel if further analysis is required. If the Validate & Upload option was not selected the process will end here.
- Regarding the Staff OBS. Only one OBS can be designed as the OBS that the interface will use to validate the Staff OBS records.
- The Staff OBS value from the template must match against the name of an OBS node in the designed Staff OBS.
- If the Staff OBS value matches against multiple nodes in the Staff OBS the record will be flagged as invalid as the process will not know which node to use.
- If the Validate & Upload option was selected the process will continue and any valid records will be xog’ed into the investment team. The xog will be executed as the user that initiated the process so any security rules enforced by xog will be respected by the process.
- Successful records will be flagged as Processed Successfully in the sub-object and remain locked. Records that did not load successfully, due to a xog error or security limitation will be flagged as Xog Load Error, unlocked, and updated with a description containing the full xog output.
- Records that failed validation or failed the xog load can be manually edited and revalidated, and attempt to be uploaded again. Subsequent runs of the process will not read in data from the file, but rather process only sub-object instances that currently exist.
-
 The interface runs using a MS Excel template called Project Allocation Upload that will be distributed to users.
 -
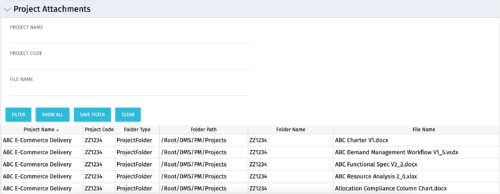 The Project Attachments portlet displays all attachments located on every project, regardless of security rights. This portlet is useful for not only the PM, but also the PMO to determine if a document has been uploaded for the toll gating process. It will also display the folder type, folder path, folder name, and file name. You have the ability to filter by project name, code, file name or file name.
 -
 The Project Attachments portlet displays all attachments located on every project, regardless of security rights. This portlet is useful for not only the PM, but also the PMO to determine if a document has been uploaded for the toll gating process. It will also display the folder type, folder path, folder name, and file name. You have the ability to filter by project name, code, file name or file name.
 -
 The Project Attachments portlet displays all attachments located on every project, regardless of security rights. This portlet is useful for not only the PM, but also the PMO to determine if a document has been uploaded for the toll gating process. It will also display the folder type, folder path, folder name, and file name. You have the ability to filter by project name, code, file name or file name.
 -
 This portlet shows the project costs by Month. The information displayed includes:
- Start Date for project
- End Date for project
- Budgeted Cost
- Planned Cost
- Actual Hours
-
 This portlet shows the project costs by Month. The information displayed includes:
- Start Date for project
- End Date for project
- Budgeted Cost
- Planned Cost
- Actual Hours
-
 This portlet shows the project costs by Month. The information displayed includes:
- Start Date for project
- End Date for project
- Budgeted Cost
- Planned Cost
- Actual Hours
-
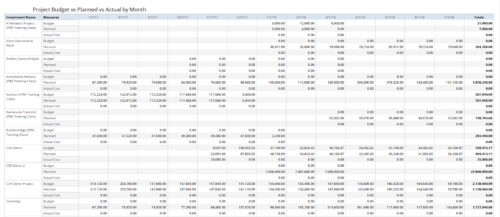 Project Budget vs Planned vs Actual by Month report provides the Project Managers a single place to view Project Budget, Planned and Actual Cost for multiple projects. Project Managers can use this view to compare various costs for that project in a particular month. User can further narrow their search by OBS Type & Path, Is Project Active?, Fiscal Month Start Date, Investment Manager and Investment Name.
 -
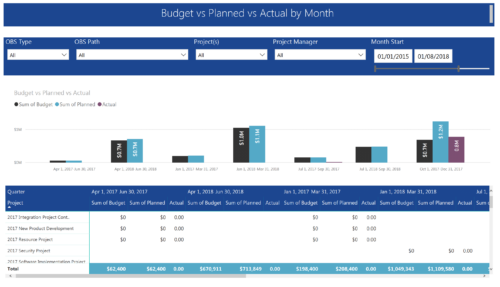 Project Budget vs Planned vs Actual by Month report provides the Project Managers a single place to view Project Budget, Planned and Actual Cost for multiple projects. This report displays Project Budget vs Planned vs Actual by Month in the form of clustered bar chart over a period of time. User can further drill down the information to investment level by selecting a particular bar within the chart. User can further narrow their search by OBS Type & Path, Project(s), Project Manager, Month Start and End Date.
 -

 The portlet, Project Change Request Count Pie with drill-down is a simple pie that displays the total count of projects in the pie. The slices are:
- Projects with 0 change requests
- Projects with 1 change request
- Projects with 2-5 change requests
- Projects with 5-10 change requests
- Projects with over 10 change requests
-
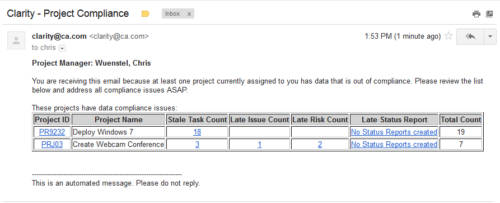 The Project Compliance Stalker – PM sends an email to Project Managers (and also their managers if so desired) at a set interval to alert them to project compliance issues. Areas of compliance that are reviewed include: stale project tasks (stale = past due date), late issues and risks (past due date) and late status reports.
 -
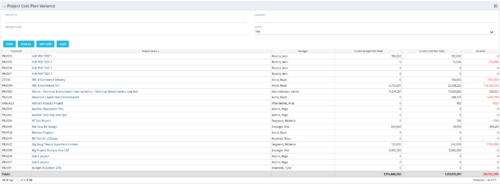 The Project Cost Plan Variance displays the variance between the budget and cost plans for projects the logged in user has security rights to view. The total for the Cost Plan that is marked as the Plan of Record for the project (Current Cost Plan Total), alongside the total for the current approved Budget Plan (Current Budget Plan Total). These two values are then compared in order to generate the total current Variance for the project. A positive amount in the Variance column indicates the project is under budget, while a negative amount indicates the project is over budget. Results may be filtered by: Project ID, Project Name, Manager, and whether the project is Active (Yes, No, All). By default, the portlet will display only Active projects.
 -
 The Project Cost Plan Variance displays the variance between the budget and cost plans for projects the logged in user has security rights to view. The total for the Cost Plan that is marked as the Plan of Record for the project (Current Cost Plan Total), alongside the total for the current approved Budget Plan (Current Budget Plan Total). These two values are then compared in order to generate the total current Variance for the project. A positive amount in the Variance column indicates the project is under budget, while a negative amount indicates the project is over budget. Results may be filtered by: Project ID, Project Name, Manager, and whether the project is Active (Yes, No, All). By default, the portlet will display only Active projects.
 -
 The Project Cost Plan Variance displays the variance between the budget and cost plans for projects the logged in user has security rights to view. The total for the Cost Plan that is marked as the Plan of Record for the project (Current Cost Plan Total), alongside the total for the current approved Budget Plan (Current Budget Plan Total). These two values are then compared in order to generate the total current Variance for the project. A positive amount in the Variance column indicates the project is under budget, while a negative amount indicates the project is over budget. Results may be filtered by: Project ID, Project Name, Manager, and whether the project is Active (Yes, No, All). By default, the portlet will display only Active projects.
 -
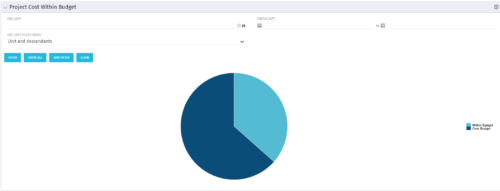
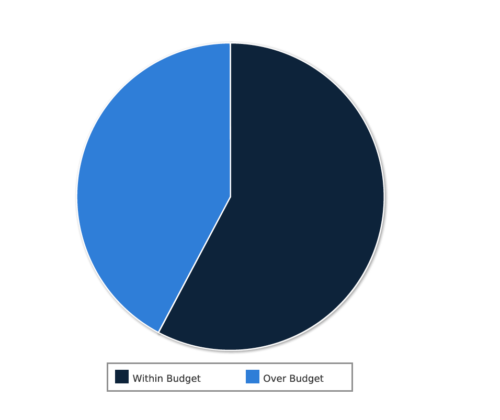 Project Cost within Budget report displays count of projects that are within or exceeding budget in the form of a pie chart. This report provides management a graphical representation of cost status on all projects. Mouse over on the pie chart displays count of projects for that category. You can further narrow your search by OBS Type & Path, Project Manager, Project Status, Project Stage, Program Name, Is project Active? And Is Template?.
 -
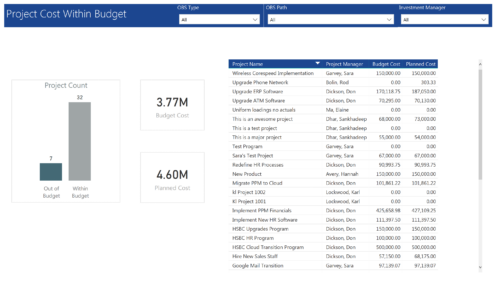 Project Cost within Budget report displays count of projects that are within or exceeding budget in the form of a bar chart. It also displays Total budget cost and Planned cost. User can further drill down the details to investment level. You can further narrow your search by OBS Type & Path and Investment Manager.
 -
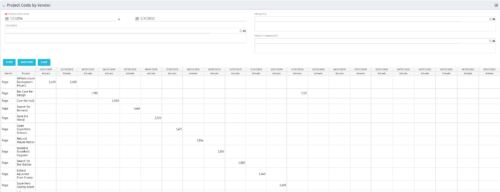
 The portlet shows the project spend to vendors by month. The Vendor field picked on the portlet comes from the Vendor mentioned when creating the voucher (as displayed on the first screenshot). This provides a nice view of identifying how much is spent by an organization on the vendor employees on their workforce.
 -

 The portlet shows the project spend to vendors by month. The Vendor field picked on the portlet comes from the Vendor mentioned when creating the voucher (as displayed on the first screenshot). This provides a nice view of identifying how much is spent by an organization on the vendor employees on their workforce.
 -

 The portlet shows the project spend to vendors by month. The Vendor field picked on the portlet comes from the Vendor mentioned when creating the voucher (as displayed on the first screenshot). This provides a nice view of identifying how much is spent by an organization on the vendor employees on their workforce.
 -
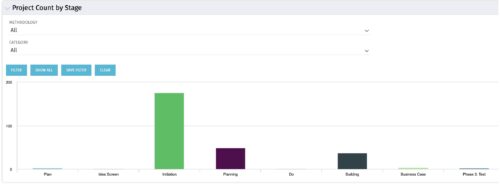
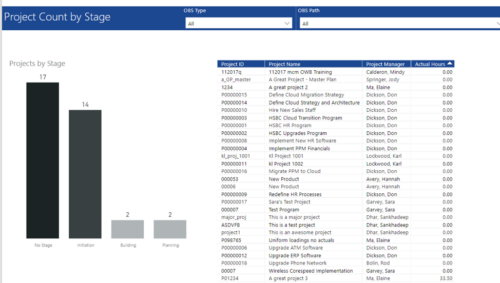
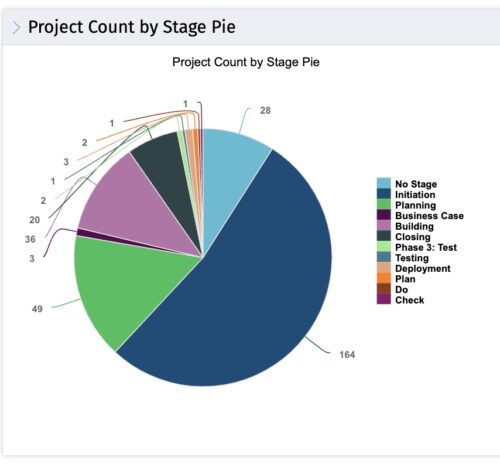
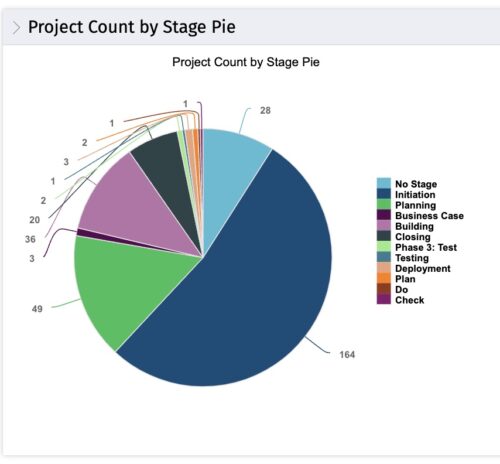 This portlet displays the projects by Stage in a pie chart. Every piece of the pie chart represents a stage of the Project Management methodology applied. The portlet also shows the number of projects on each stage. The legend displays all the different project stages appearing on the portlet. This portlet can be filtered to show only projects from a particular OBS unit or for a particular Project Manager.
 -
 This portlet displays the projects by Stage in a pie chart. Every piece of the pie chart represents a stage of the Project Management methodology applied. The portlet also shows the number of projects on each stage. The legend displays all the different project stages appearing on the portlet. This portlet can be filtered to show only projects from a particular OBS unit or for a particular Project Manager.
 -
 This portlet displays the projects by Stage in a pie chart. Every piece of the pie chart represents a stage of the Project Management methodology applied. The portlet also shows the number of projects on each stage. The legend displays all the different project stages appearing on the portlet. This portlet can be filtered to show only projects from a particular OBS unit or for a particular Project Manager.

