-
 Course Description: We once had a client refer to the reports they developed as “Fisher-Price” reports. Reports should be built with consistency using graphic design principles. Join a Rego architect and UX designer to learn some fundamental graphic design principles such as grid theory, ink-to-data ratio, flow, balance, and more. Come prepared to be "wowed."
 -
 Many times Roles are spread out geographically or by function and these Roles will have different rates. For example, a developer in India may charge $25/hour vs a Developer in US may charge $50/hour. When the project team has a requirement of several developers, the PM will have to add a region specific role (Developer-US, Developer-India) so that the right rates can be applied when a cost plan is created. This creates a challenge in terms of Resource Management. As the Demand and Capacity can be spread between different region specific roles. Proper configuration on the Rate Matrix can allow you to have one Role name but different rates based on Location or Department. This allows greater flexibility and takes away the redundancy of Role Names. You can do so with the Project Team Member Properties.
 -
 Finding the right project manager can be tricky. How do you know which candidates have the appropriate leadership, forecasting, and problem-solving skills? Interviewing strategies can make all the difference. This paper discusses important ways you can prepare for a project manager interview. It points out hazards to sidestep and best practices for identifying candidates with the right proficiency. This White Paper is downloaded from the Rego Consulting site. You will be asked to provide your email address and current ppm tool. - http://info.regoconsulting.com/how-to-hire-the-right-pm ** No Download - Do not Add to Cart **
 -
 This paper will help you launch a PMO—or facelift the one you’ve got—by making sure your PMO charter can handle strategic heavy lifting. It covers everything from getting stakeholder buy-in to achieving successful adoption throughout your organization. This White Paper is downloaded from the Rego Consulting site. You will be asked to provide your email address and current ppm tool. - http://info.regoconsulting.com/launch-pmo-whitepaper ** No Download - Do not Add to Cart **
 -
 Project & Portfolio Management is a Significant Investment. How do you get the most return on your investment? How do you squeeze the most value out of the processes and functionalities it provides? How do you make sure your PPM assets align with your current and future objectives? Like many business problems, the answer lies partly in asking the right questions. So let’s start there. In this white paper, we’ll review a broad array of questions you should be asking your PPM vendor to make sure you’re making the right choices, whether you’re considering a potential implementation or optimizing your current PPM environment. This White Paper is downloaded from the Rego Consulting site. You will be asked to provide your email address and current ppm tool. - http://info.regoconsulting.com/select-best-ppm-vendor ** No Download - Do not Add to Cart **
 -
 Join Rego’s senior Agile guides and learn best-practice usage patterns to support your ART-level practices with Rally Software. We’ll explore all the ceremonies in a team-of-team (ART) program increment and how you can use Rally to align, simplify, and leverage for scaled delivery of high-value solutions.
 -
 Course Description: Have you ever wanted to build portlets that were not limited by Clarity PPM's out-of-the-box portlet types? This class will explore some of the options you can use to build helpful portlets with HTML, including calendars, Kanban boards, tile-based project lists, and some special Star Wars-themed communication portlets.
 -
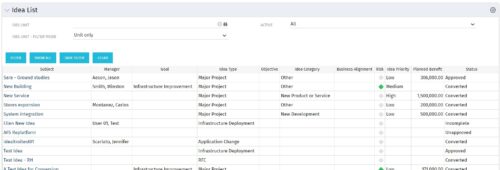
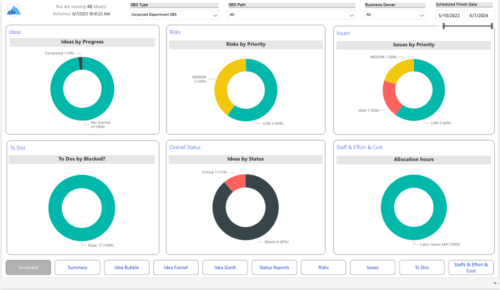 Master your pipeline as you prioritize, visualize, and analyze ideas, assess their feasibility, and track progress from inception to execution. Report Views include: • Idea Bubble • Idea Details • Idea Funnel • Idea Gantt • Idea Overview • Idea Staff and Effort • Idea Status • Idea To Dos Demo Video - https://www.youtube.com/watch?v=xPSxOlrqEq8&list=PLXJ5ktuWV0jiS9CvBpHvBIwpKPmA9uvwK&index=3 The main .rpt file will access data through the Data Warehouse. For clients on Rego’s AWS hosting, we have versions that work with Oracle and Postgres DB and access the live database, if the Rego Odata connector is being used.


