-
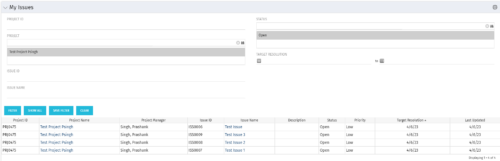 The My Issues portlet displays all issues within active project that the logged in user is assigned to. The portlet provides the logged in user a single place to view issues across multiple projects without having to go into each project individually. The filter then allows the user to narrow their search by Issue ID, Issue Name, Project ID, Project Name, and Issue Status. You may also narrow the view to display issues with a target resolution date within a certain date range.
 -
The My Issues portlet displays all issues within active project that the logged in user is assigned to. The portlet provides the logged in user a single place to view issues across multiple projects without having to go into each project individually. The filter then allows the user to narrow their search by Issue ID, Issue Name, Project ID, Project Name, and Issue Status. You may also narrow the view to display issues with a target resolution date within a certain date range.
-
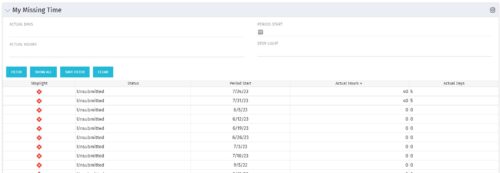 The My Missing Time portlet displays all open time periods for which the logged in user (assuming they are open for time entry with a track mode of Clarity) has a timesheet that is not posted (accommodates for hire and termination dates). The portlet is used as a quick reference for users to view their missing time.
 -
The My Missing Time portlet displays all open time periods for which the logged in user (assuming they are open for time entry with a track mode of Clarity) has a timesheet that is not posted (accommodates for hire and termination dates). The portlet is used as a quick reference for users to view their missing time.
-
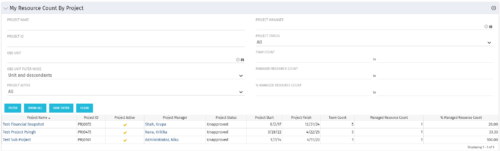 The My Resource Count by Project portlet displays project information, total team count and the current user’s resource count assigned to each project. The user may narrow the results by filtering on project name, manager, status, team count, managed resource count or percentage managed resource count. Using this portlet, resource managers can quickly identify which projects their resources are allocated to without having to navigate to each resource individually. Not only does this portlet display the overall team count on the project (team count), but it also displays the managed resource count (logged in user’s number of resources allocated to the project) as well as the percentage of managed resource count to team count.
 -
The My Resource Count by Project portlet displays project information, total team count and the current user’s resource count assigned to each project. The user may narrow the results by filtering on project name, manager, status, team count, managed resource count or percentage managed resource count. Using this portlet, resource managers can quickly identify which projects their resources are allocated to without having to navigate to each resource individually. Not only does this portlet display the overall team count on the project (team count), but it also displays the managed resource count (logged in user’s number of resources allocated to the project) as well as the percentage of managed resource count to team count.
-
 The My Resource Vacation portlet allows a resource to view the current logged in users' annual vacation allowance, as set by the resource manager, against the resource vacation calendar hours and actual posted timesheet hours. The portlet is useful for determining the amount of hours a resource has requested off and has remaining. The portlet also ensures the resource has accounted for all annual vacation allowance hours in the calendar and has posted time for all past calendar request hours.
 -
The My Resource Vacation portlet allows a resource to view the current logged in users' annual vacation allowance, as set by the resource manager, against the resource vacation calendar hours and actual posted timesheet hours. The portlet is useful for determining the amount of hours a resource has requested off and has remaining. The portlet also ensures the resource has accounted for all annual vacation allowance hours in the calendar and has posted time for all past calendar request hours.
-
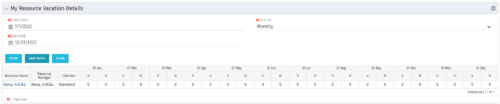 The My Resource Vacation Details portlet returns the logged in users calendar at a glance by week or month for a selected time period. It shows the Resource Name, Resource Manager, Calendar, H (holiday), and V (vacation) hours for the select time frame.
 -
The My Resource Vacation Details portlet returns the logged in users calendar at a glance by week or month for a selected time period. It shows the Resource Name, Resource Manager, Calendar, H (holiday), and V (vacation) hours for the select time frame.
-
The My Resource Vacation Details portlet returns the logged in users calendar at a glance by week or month for a selected time period. It shows the Resource Name, Resource Manager, Calendar, H (holiday), and V (vacation) hours for the select time frame.
-
 The My Resources’ Time by Quarter and Type portlet displays all subordinate resources’ time by type for each quarter. The portlet is able to display either actuals or estimates for each resource. This portlet allows the resource manager to see how each of his or her resources’ time is utilized by project type. The user may filter on a specific date range (quarter) and resource OBS.
 -
The My Resources’ Time by Quarter and Type portlet displays all subordinate resources’ time by type for each quarter. The portlet is able to display either actuals or estimates for each resource. This portlet allows the resource manager to see how each of his or her resources’ time is utilized by project type. The user may filter on a specific date range (quarter) and resource OBS.
-
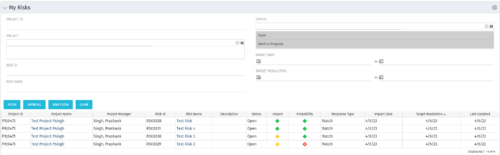 The My Risks portlet displays all risks related to active projects that the logged in user has been assigned as the owner. The portlet provides the logged in user a single place to view risks across multiple projects without having to go into each project individually. The filter then allows the user to narrow their search by Risk ID, Risk Name, Project ID, Project Name, and Risk Status. You may also narrow the view to display issues with a target resolution date or impact date within a certain date range.
 -
The My Risks portlet displays all risks related to active projects that the logged in user has been assigned as the owner. The portlet provides the logged in user a single place to view risks across multiple projects without having to go into each project individually. The filter then allows the user to narrow their search by Risk ID, Risk Name, Project ID, Project Name, and Risk Status. You may also narrow the view to display issues with a target resolution date or impact date within a certain date range.
-
 This training document is a Rego Consulting Quick Reference Guide to assist with the My Tasks View in Clarity’s Modern User Experience. Guide shows how Tasks are access by use of the Task icon in the menu.
 -
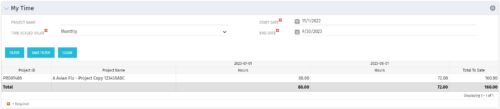 The My Time portlet provides the logged in user with the ability to view his or her time by project by time period without having to go into each period individually on the Timesheets page. This portlet uses the actual timeslices to retrieve data. It displays the amount of time worked per week, month or quarter on projects. The user may specify the dates, time-scaled value and the project name. The portlet also provides a Total to Date, which shows the total number of actuals for that resource on that assignment.
 -
The My Time portlet provides the logged in user with the ability to view his or her time by project by time period without having to go into each period individually on the Timesheets page. This portlet uses the actual timeslices to retrieve data. It displays the amount of time worked per week, month or quarter on projects. The user may specify the dates, time-scaled value and the project name. The portlet also provides a Total to Date, which shows the total number of actuals for that resource on that assignment.
-
 Are you on an older version of CA PPM? Do you want to understand the value of the new features and functions in recent versions? Have you seen the new UX and do you wonder when is the right time to move over? This class is a demonstration of the new UX, new features in both classic and new UX, and the value of these features for customers.
 -
 CA has advertised the addition of RESTful APIs into the core product in version 14.3. What does this mean to you? What does this do to help you support CA PPM? This class will review the new APIs and discuss what they enable for you.
 -
 Clarity’s new reporting capabilities deliver interactive insights directly within the platform—no data exports required. In this session, you’ll learn how to harness the latest reporting features to empower decision-makers, visualize portfolio performance, and tell compelling stories with your data.
 -
 IT is the most common PPM use case, but we are seeing more and more non-IT groups embrace CA PPM. This class will go through the most common PPM use cases outside of IT - Engineering, NPD, PSA, Audit, Marketing, etc.
 -
 Apptio can be used for so much more than App TCO and Service Costing. Let's talk about valuable non-traditional use cases you might want to consider exploring.
 -
 A review of how Northern Trust integrates financial systems with Clarity PPM bilaterally, providing the Finance organization crucial information, and NT Project Managers with a birds-eye view of project financials. Utilizing the Rego Data Extractor and the Rego Data Processor, these information exchanges help Portfolio and Project Managers eliminate their manual and redundant efforts, solidify their overall data accuracy, and dramatically improve the content provided to their Execs for decision-making.
 -
 Course description: “Are you an NPD CA PPM user? This session is dedicated to NPD users to discuss some of the unique requirements and configurations needed to support project management for new product development.” Download file is the slide deck used for the presentation.
 -
 A presentation slide deck from Rego University 2022. The course outline document for the creation of NSQL Portlets for Clarity.
- Multi-Dimensional Portlets
- NSQL Syntax
- Creating a sample portlet
- Limitations
- Common errors and best practices
- Hierarchical Portlets
- NSQL Syntax
- Creating a sample portlet
- Limitations and best practices
- Multi-Dimensional Portlets
-
 A presentation slide deck from Rego University 2022. The course outline for developing NSQL Portlets, Intermediate Level, for Clarity.
- Chart Portlets
- Types / Uses
- Creating a sample portlet
- Limitations
- Drilldown Portlets
- Overview
- Example
- Other Examples and Assets
- Chart Portlets
-
 Nudge is a new tool developed by Rego to capture team sentiment in an anonymous, unobtrusive way, using micro surveys through MS Teams.


Copyright 2023 • Rego Consulting Corporation • Privacy Policy