- Inactive User is the Project Manager
- Inactive User is the Idea Manager
- Inactive User is the Resource Manager
- Tasks assigned to the user
- Action items assigned to the user
- Risks assigned to the user
- Issues assigned to the user
- Change requests assigned to the user
- Incidents assigned to the user
-
 The Inactive Resource Data Cleanup portlet displays information for inactive resources that still have pending items on active objects:
 -
 The Inactive Resource Data Cleanup portlet displays information for inactive resources that still have pending items on active objects:
- Inactive User is the Project Manager
- Inactive User is the Idea Manager
- Inactive User is the Resource Manager
- Tasks assigned to the user
- Action items assigned to the user
- Risks assigned to the user
- Issues assigned to the user
- Change requests assigned to the user
- Incidents assigned to the user
-
 The Inactive Resource Data Cleanup portlet displays information for inactive resources that still have pending items on active objects:
- Inactive User is the Project Manager
- Inactive User is the Idea Manager
- Inactive User is the Resource Manager
- Tasks assigned to the user
- Action items assigned to the user
- Risks assigned to the user
- Issues assigned to the user
- Change requests assigned to the user
- Incidents assigned to the user
-
 This view depicts trends of created and resolved Incidents over time, grouped by month. The count of incidents opened is determined by the Created Date of the Incident, and the count of Incidents closed is determined by the Resolution Date of the Incident. The view is filterable by Priority and Urgency as well as a date range. NOTE: The values returned are the total sum for a given month, not a cumulative total over time.
 -
 Do you want to talk to other customers that are using or plan to use demand management? In this moderated Round Table where customers can share experiences and provide insights on process, configurations, challenges, and successes. We will have an expert panel and then divide into small groups and discuss customer selected topics - 100% sharing.
 -
 An engaging, informative session delivered to your organization by a Prosci change management expert. Your leaders, project managers, and others focused on project outcomes will learn how applying change management to projects can increase the likelihood of those projects succeeding. They will also learn about the processes, people and tools needed to align project management and change management.
 -
 You can’t wait, integrate! Clarity is highly capable of being the center of a hub and spoke ecosystem for your project delivery. With flexible integration options and robust portfolio reporting and decision support functionality, Clarity will help you consolidate data from multiple systems of record into one source of truth. Join this class to see common use cases for optimizing a PPM delivery value stream that cuts across a diverse suite of applications, including HR, Finance, ITSM, Agile, Work Management, and many more.
 -
 Do you want to know more about building file-based integrations? Does your organization have an external BI tool like Cognos, Tableau, Domo, or Qlikview? This session will review strategies for getting data into your corporate BI tools. We will also show Rego's data extraction tool and how it can be used for all outbound file-based integrations to save money and time.
 -
 Do you want to know more about building file-based integrations? Does your organization have an external BI tool like Cognos, Tableau, Domo, or Qlikview? This session will review strategies for getting data into your corporate BI tools. We will also show Rego's data extraction tool and how it can be used for all outbound file-based integrations to save money and time.
 -
 Do you want to add interfaces to your CA PPM instance? This class will review the pros and cons of various integration methods and provide best practice on how to handle various interfaces. We’ll walk you through specific interface examples and showcase Rego’s pre-built interface sets you can leverage to reduce the time and cost of implementation.
 -
 A presentation slide deck from Rego University 2022. This document outlines the advantages of using the Rego Data Processor and Data Extractors for integrations with other software tools. • Introduction • Understanding Clarity and its Architecture • Why use Integrations • Wheel and Spoke • Outbound Integrations • Inbound Integrations • Rego’s Approach • Rego’s Data Processor • Rego’s Data Extractor • Recommendations
 -
 Course Description: In the new bimodal IT environment, does your organization lack insights into what Agile work is being done and what value is being delivered? Learn how Apptio Agile Insights merges data from multiple Agile tools, including Clarity PPM, to bring together a total picture of the value IT is delivering.
 -
 Rego’s training materials on Clarity PPM Financials. This slide deck in based on the classic version of Clarity v15.4.1. Course materials start with an introduction, move to Cost Plans, Budget Plans and then finish with Reporting of Financial Data. There is also an appendix of supporting information.
 -
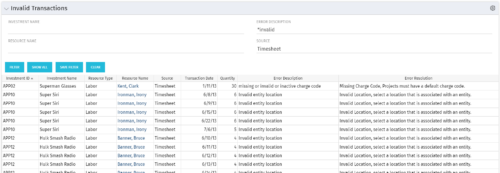
 The Invalid Transactions portlet displays all of the transactions that did/will not post in Clarity. The benefit of this portlet is that you can use the filter to select a specific project, resource, or error to display all transactions associated to your selection. There are several reasons a transaction may fail to post such as inactive resource, no location or inactive location selected on the Financial sub-page, project on hold, etc. To resolve the error, the user must go into the project or resource and make the noted change. Once all corrections are complete, the Post Transactions to Financials job must be run to evaluate the corrected WIP transactions to be sure the data is now complete and accurate. If additional incorrect data is found, the transaction will fail to post again and the new error/reason will display.
 -
 The Invalid Transactions portlet displays all of the transactions that did/will not post in Clarity. The benefit of this portlet is that you can use the filter to select a specific project, resource, or error to display all transactions associated to your selection. There are several reasons a transaction may fail to post such as inactive resource, no location or inactive location selected on the Financial sub-page, project on hold, etc. To resolve the error, the user must go into the project or resource and make the noted change. Once all corrections are complete, the Post Transactions to Financials job must be run to evaluate the corrected WIP transactions to be sure the data is now complete and accurate. If additional incorrect data is found, the transaction will fail to post again and the new error/reason will display.
 -
 The Invalid Transactions portlet displays all of the transactions that did/will not post in Clarity. The benefit of this portlet is that you can use the filter to select a specific project, resource, or error to display all transactions associated to your selection. There are several reasons a transaction may fail to post such as inactive resource, no location or inactive location selected on the Financial sub-page, project on hold, etc. To resolve the error, the user must go into the project or resource and make the noted change. Once all corrections are complete, the Post Transactions to Financials job must be run to evaluate the corrected WIP transactions to be sure the data is now complete and accurate. If additional incorrect data is found, the transaction will fail to post again and the new error/reason will display.
 -
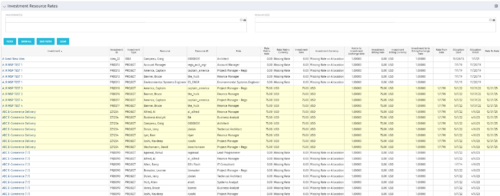
 The Investment Resource Rate portlet allows a user to search for effective (or missing) rates for resources across all investment types. It pulls rate information from the matrix extraction tables and includes currency conversion if the environment supports multiple currencies. The portlet can be used both to search for the rate of any given resource and to determine which resources might be missing rates when an error is generated when attempting to populate a cost plan (REVMGR-20728:Rates and Costs are both missing for one or more roles/resources).


