- OBS
- Portfolio
-
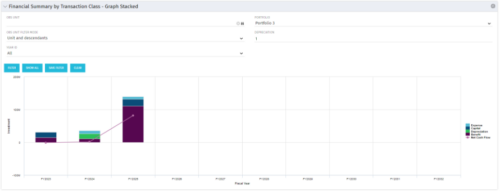
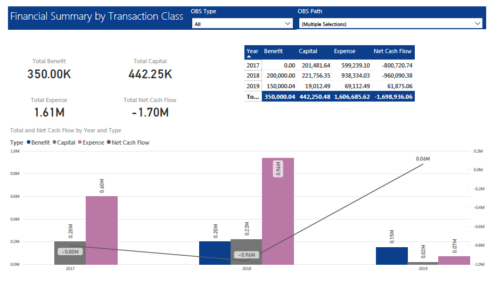 The Financial Summary by Transaction Class provides a visual graph for each year’s financial picture for multiple years. Report contains the following items: KPIs: Displays total benefit, capital, expense and net cash flow for the selected filter criteria Grid: Displays year wise break up of benefit, capital, expense and net cash flow for the selected filter criteria Graph: Benefit, capital, expense and net cash flow are depicted in graphical way for multiple years. This report will show the user where they need to concentrate their efforts in order to meet financial commitments. User can further narrow their search by OBS Type & Path.
 -
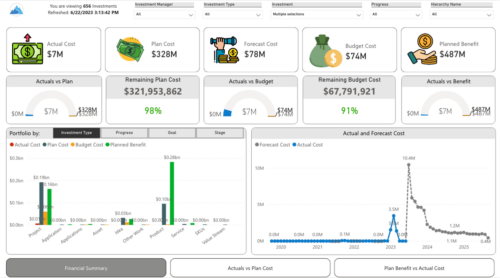
 Gain a financial view of your investments by comparing actuals to planned cost and planned benefit. Report views include: • Financial Summary • Planned Benefit vs Actual Cost • Actuals vs Planned Costs Demo Video - https://www.youtube.com/watch?v=uyDSbbgG1O8&list=PLXJ5ktuWV0jiS9CvBpHvBIwpKPmA9uvwK&index=2
 -
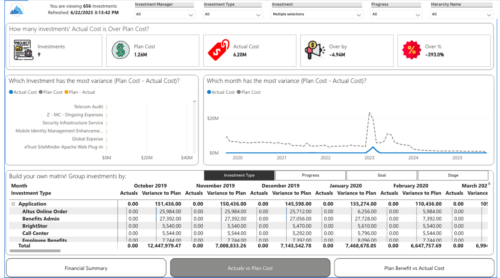
 Gain a financial view of your investments by comparing actuals to planned cost and planned benefit. Report views include:
- Financial Summary
- Planned Benefit vs Actual Cost
- Actuals vs Planned Costs
-
 Have you never used GEL within Clarity? This class will teach you the basics of leveraging GEL within your workflow process. It’s one of the most powerful and underutilized capabilities in Clarity for updating objects, sending emails, and XOGing. This class is designed for those that have never used GEL before.
 -

 ** No Download - Do not Add to Cart** - Register for the White Paper at this link - http://info.regoconsulting.com/clarity-innovations-from-rego-march-2020 With enterprise-level interconnectivity on the rise, many organizations find that their Clarity toolset isn’t as tightly integrated as it could be. Disparate platforms, annoying redundancies, and personal tool preferences may result in significant losses in time, productivity, and money. In this white paper, we’ll briefly discuss six Rego innovations and connectors designed to help organizations get more out of their Clarity investment. - http://info.regoconsulting.com/clarity-innovations-from-rego-march-2020 With enterprise-level interconnectivity on the rise, many organizations find that their Clarity toolset isn’t as tightly integrated as it could be. Disparate platforms, annoying redundancies, and personal tool preferences may result in significant losses in time, productivity, and money. In this white paper, we’ll briefly discuss six Rego innovations and connectors designed to help organizations get more out of their Clarity investment.
 -
 The Give PM Collaboration Manager Rights workflow process can be run through the "Execute a Process" job. The workflow will execute a query that gives a Project Manager the Collaboration Manager rights to their projects. Often times, PMs are not set as Collaboration Managers when the project is created. This script can be run to automatically give a PM the Collaboration Manager rights to their projects, without having to go through the projects one by one.
 -
 The Give PM Collaboration Manager Rights workflow process can be run through the "Execute a Process" job. The workflow will execute a query that gives a Project Manager the Collaboration Manager rights to their projects. Often times, PMs are not set as Collaboration Managers when the project is created. This script can be run to automatically give a PM the Collaboration Manager rights to their projects, without having to go through the projects one by one.
 -
 The Give PM Collaboration Manager Rights workflow process can be run through the "Execute a Process" job. The workflow will execute a query that gives a Project Manager the Collaboration Manager rights to their projects. Often times, PMs are not set as Collaboration Managers when the project is created. This script can be run to automatically give a PM the Collaboration Manager rights to their projects, without having to go through the projects one by one.
 -
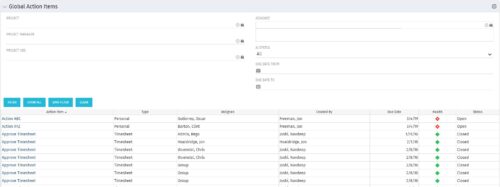 The Global Action Items portlet will help users and clarity admins to keep track of action items in the CA PPM system. This is useful to keep track of Timesheet Approval through Action Item or any other Action Item related workflows. The portlet displays Name, Type Assignee, Created by, Due Date, Health and Status of the Action Items as default columns. The portlet provides Project, Project Manager, Project OBS, Assignee, Status and Due Dates of the Action Items as default filters.
 -
 The Global Action Items portlet will help users and clarity admins to keep track of action items in the CA PPM system. This is useful to keep track of Timesheet Approval through Action Item or any other Action Item related workflows. The portlet displays Name, Type Assignee, Created by, Due Date, Health and Status of the Action Items as default columns. The portlet provides Project, Project Manager, Project OBS, Assignee, Status and Due Dates of the Action Items as default filters.

