-
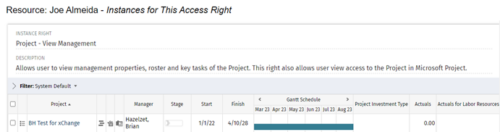
 This process grants Project Management instance rights to all of the project team members within the program hierarchy. Allows users to view management properties, roster and key tasks of the project. This also allows user view access to the project in Microsoft Project.
 -
This process grants Project Management instance rights to all of the project team members within the program hierarchy. Allows users to view management properties, roster and key tasks of the project. This also allows user view access to the project in Microsoft Project.
-
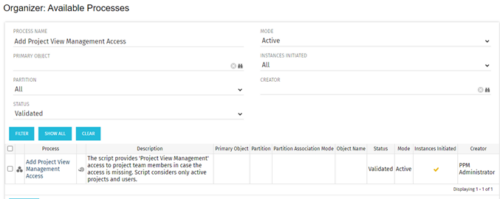
This process grants Project Management instance rights to all of the project team members within the program hierarchy. Allows users to view management properties, roster and key tasks of the project. This also allows user view access to the project in Microsoft Project.
-
 A presentation slide deck from Rego University 2022. An outline of topics used for a Apptio Round-Table discussion.
 -
 Reporting is typically the only interaction executives, and stakeholders have with Apptio, so reports should be pristine. In this session, we will show you how to improve your Apptio reporting, making it more visually appealing, intuitive, and digestible. We'll give you some tips on how to make your reporting in Apptio pop out like conditional highlighting, leveraging html components, layout and design techniques.
 -
 A presentation slide deck from Rego University 2022. This class reviewed Apptio reporting options, tips & tricks, etc.
- Introduction
- Reporting Options for Apptio
- Reporting Tips & Tricks
- Reporting best practices
- Custom Report Showcase
-
 Set yourself up for success in IT planning by learning the ins and outs of Apptio's ITP. We will cover tips and tricks, best practices, and ways to use ITP to push your organization to the next level.
 -
 A presentation slide deck from RegoU 2023. This course reviewed the abundant ways to document information within Apptio.
 -
 Discover the secrets to fine-tuning your ApptioOne model's performance by learning about common issues and their resolutions. This session covers model reviews to ensure accurate cost representation, optimization strategies for your ApptioOne environment, and how to effectively utilize the Apptio Performance Component. Enhance your skills and improve your model's overall efficiency with the valuable insights shared in this session.
 -
 Learn how Apptio BI, an intuitive ad-hoc reporting solution, serves as a one-stop shop for custom data needs, saving time and energy for TBMAs. This hands-on session will guide you through setting up Apptio BI, discuss best practices for deployment, and demonstrate how it unifies the best aspects of ApptioOne and Cloudability for a holistic understanding of IT spend. Master the fundamentals of creating an Apptio BI dashboard and optimize your IT financial management experience.
 -
 A presentation slide deck from Rego University 2022. This deck reviews Apptio’s self-service reporting tool. This tool is geared towards end users and empowers them to create and share their own reports.
 -
 A presentation slide deck from Rego University 2022. This document reviews how Clarity and Apptio can work together.
- Typical Challenges
- Apptio Introduction
- Clarity / Apptio Solution
- Rego’s BETA Integration


Copyright 2023 • Rego Consulting Corporation • Privacy Policy