-
 This training document is a Rego Consulting Quick Reference Guide to assist with the management of Custom Investment Types in Clarity’s Modern User Experience. This doc references version 16.0.2 views. Document provides detail on how to create a Custom Investment Type and how to create Custom Investment records from the Grid View and the Board View.
 -
 This training document is a Rego Consulting Quick Reference Guide to assist with population of project properties in Clarity’s Modern User Experience. This doc references version 16.0.2 views. Doc covers Project Tiles View, Project Properties – Details page and updating from the Project List view.
 -
 This training document is a Rego Consulting Quick Reference Guide to assist with the use of the Staffing Plan in Clarity’s Modern User Experience. This doc references version 16.0.2 views. Document provides information on how to swap between views to see investments by resource or resources by investment. Instructions on filtering are provided, as well as detail on how to update the unit of measure between FTE (Full Time Equivalent) and Hours. Tips are provided on how to expand the list of investments within each view and how to view the properties for the allocations. A Legend is also documented to provide information on each of the icons that are displayed on this page.
 -
 A Quick Reference guide to assist in creating an Idea in Clarity’s Classic UX. Document shows the process with the Phoenix theme applied.
 -
 A Quick Reference Guide to assist in the use of the Waterline to Optimize Portfolios in Clarity’s Classic UX. Reviews waterline menu, ranking rules, and use of filters.
 -
 A Quick Reference Guide on the use of the Timeline View for Roadmaps in Clarity’s Modern UX. Reviews accessing the view, view options, and dependencies.
 -
 A Quick Reference Guide to assist in the staffing of an Idea in Clarity’s Classic UX.
 -
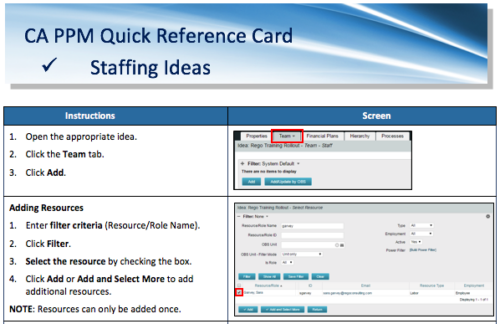 A Quick Reference Card to assist in adding resources and roles to Ideas in the Classic UX. Updating Allocation is also covered.
 -

 Pie Chart displays projects by Baseline Finish Variance—is current project finish beyond baseline finish; or is current project finish on or before baseline finish. Filterable by OBS structure and Finish Date range. Data labels show percent within baseline vs percent outside baseline. Mouse-over shows Within or Outside label and percent of total projects. Legend shows color coded Within Baseline and Outside Baseline labels. Drilldown: Clicking on a pie slice yields a grid portlet of projects either Within or Outside Baseline.
 -
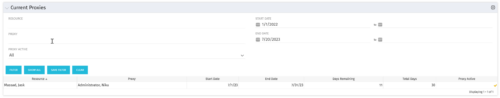 The Current Proxies portlet provides a user with an overview of all the resources in the system currently using a proxy. This portlet is helpful to determine a proxy if a user is currently out of the office. The portlet provides several pieces of information related to the resource including: resource names, proxy, start date, end date, days remaining, total days, and if the proxy is active. The user may filter by resource name, proxy name, proxy status (defaults to Yes), and start/end dates (defaults to the current date).
 -
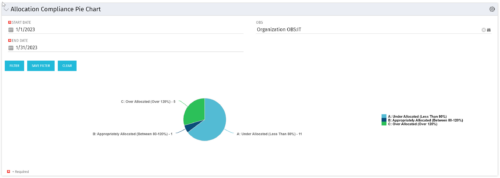 The Allocation Compliance Pie Chart portlet gives a view of active resources' allocation compliance within a date range and OBS displayed in a pie chart. It allows the user to the percentage of resources over, under, and adequately staffed on projects over a selected time period. This portlet leverages the daily allocation and daily availability slices as well as only active investments. The portlet provides filters for specific dates (required) and OBS.


Copyright 2023 • Rego Consulting Corporation • Privacy Policy