-
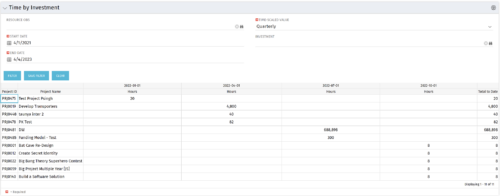
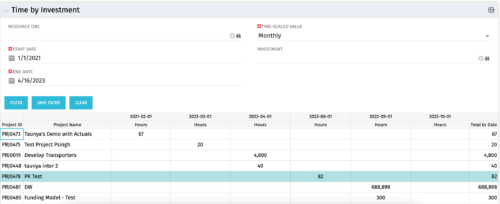 The Time by Investment portlet displays time logged to investments for all investments the logged in user has security rights to view using data from timeslices. It is capable of displaying the data by annual, quarterly, monthly, weekly, and daily segments with totals per date also being presented. The portlet may can be filtered by investment, resource OBS, and time segments. This portlet can be used as a management and governance tool to review aggregate hours posted to investments by time period.
 -
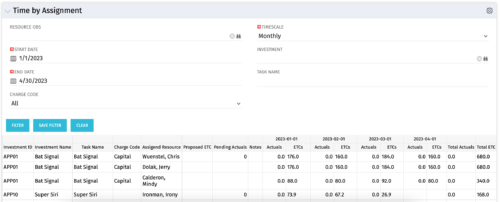 The Time by Assignment portlet displays time logged to assignments for all investments the logged in user has security rights to view - pulling data from the timeslices. It is capable of displaying the data by weekly, monthly or quarterly segments. The portlet may also be filtered by investment and resource OBS.
 -
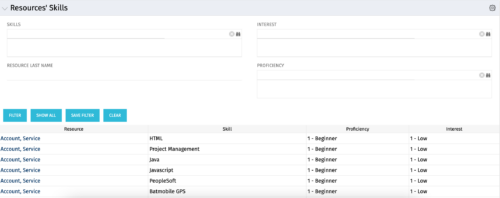 The Resources’ Skills portlet displays all resources, skills, proficiencies, and interests. Using this portlet, resource managers can quickly assess all skills within the system for their resources. The portlet results may be filtered on: Skill, Resource Last Name, Interest and Proficiency.
 -
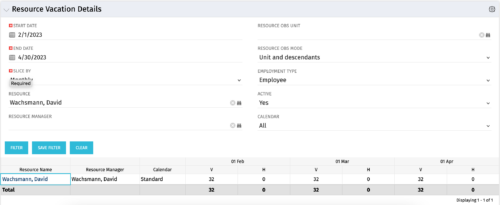 The Resource Vacation Details portlet allows a resource manager, or administrator, to see a resource’s calendar at a glance, displayed by week or month for a selected time period. This portlet shows the Resource Name, Resource Manager, Calendar, H (holiday), and V (vacation) hours for the select time frame.
 -
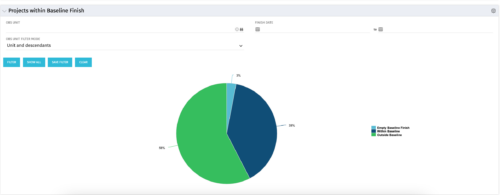 The Projects Within Baseline Finish portlet displays all projects that have a baseline and presents them in a pie chart. This portlet provides management with a way to quickly view the number of projects that are on time. The user may filter by OBS and finish date.
 -
 The Projects Marked for Deletion portlet displays information about projects that are currently pending deletion but excludes templates and programs. This portlet provides an easy way to view all projects that are marked for deletion before the background job actually erases them. The portlet provides all necessary information as well as the project manager in case there are questions about why the project was marked for deletion.
 -
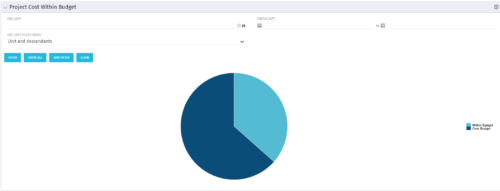 The Project Cost Within Budget portlet shows all projects that are within or exceeding their budgets in a pie chart. The user may filter by OBS and finish dates to narrow the projects. This portlet provides management with a graphical representation of the overall status of cost on all projects.
 -
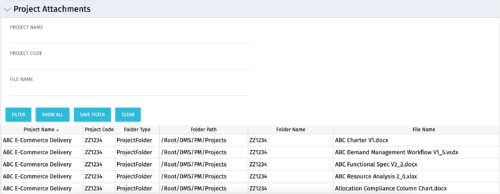 The Project Attachments portlet displays all attachments located on every project, regardless of security rights. This portlet is useful for not only the PM, but also the PMO to determine if a document has been uploaded for the toll gating process. It will also display the folder type, folder path, folder name, and file name. You have the ability to filter by project name, code, file name or file name.
 -
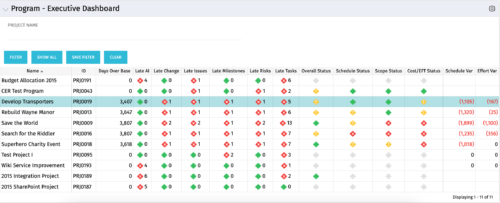 The Program Executive Dashboard portlet displays information regarding sub-projects on a program. It provides a one-stop place for the PMO or management to view all critical information about projects under a specific program. The portlet displays status indicators, dates for late items, variances and days over base, it also displays the project status fields from the Status Report sub-object.
 -
The Program Executive Dashboard portlet displays information regarding sub-projects on a program. It provides a one-stop place for the PMO or management to view all critical information about projects under a specific program. The portlet displays status indicators, dates for late items, variances and days over base, it also displays the project status fields from the Status Report sub-object.
-
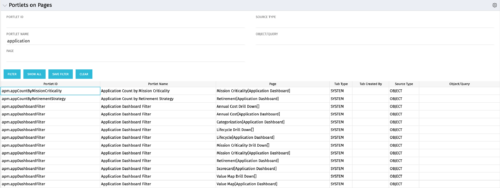 Portlets on Pages displays portlets located on each page within Clarity. This portlet is useful for administrators to determine which users have customized their pages and if they are not seeing a certain portlet, or if a user has placed a portlet on another page and needs help locating it. It also shows the portlet code, name, page the portlet resides on, tab type, who created the tab, source type, and the object/query.


Copyright 2023 • Rego Consulting Corporation • Privacy Policy