-
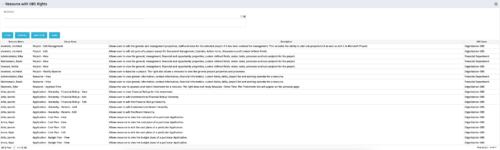 This portlet displays list of resources with OBS rights. This would be helpful for admins to know if a user can perform any actions on object instances of an OBS.
 -
This portlet displays list of resources with OBS rights. This would be helpful for admins to know if a user can perform any actions on object instances of an OBS.
-
This portlet displays list of resources with OBS rights. This would be helpful for admins to know if a user can perform any actions on object instances of an OBS.
-
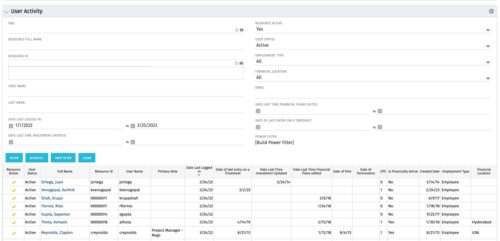 The User Activity portlet is in essence an expansion of the out of the box User List by License Type portlet, which only display the Last Logged In date of resources. This portlet offers several additional fields to help admins dig deeper into user activity within the tool. The table below describes the available filter fields for the portlet.
Column Label Description OBS OBS the resource(s) belong to Resource Full Name Resource’s First and Last Name Resource ID Resource’s ID First Name Resource’s First Name Last Name Resource’s Last Name Date Last Logged In Date the Resource last logged in Date Last Time Investment Updated Date the Resource last made an Investment update Resource Active The Resource’s active status Employment Type Resource’s Employment Type Financial Location Resource’s Financial Location Email Resource’s Email Address Date Last Time Financial Plans Edited Date the Resource last made a Financial Plan edit Date of last entry on a Timesheet Date the Resource last made an entry on a timesheet Created Date Date the resource was added to the system Date of Hire Resource’s Date of Hire Date of Termination Resource’s Date of Termination Financial Department Resource’s Financial Department Home Page Resource’s Home Page Language Default Language of the Resource Primary role Resource’s Primary Role Resource manager Resource’s Manager Track Mode Resource’s Track Mode User Name Resource’s Username -
The User Activity portlet is in essence an expansion of the out of the box User List by License Type portlet, which only display the Last Logged In date of resources. This portlet offers several additional fields to help admins dig deeper into user activity within the tool. The table below describes the available filter fields for the portlet.
Column Label Description OBS OBS the resource(s) belong to Resource Full Name Resource’s First and Last Name Resource ID Resource’s ID First Name Resource’s First Name Last Name Resource’s Last Name Date Last Logged In Date the Resource last logged in Date Last Time Investment Updated Date the Resource last made an Investment update Resource Active The Resource’s active status Employment Type Resource’s Employment Type Financial Location Resource’s Financial Location Email Resource’s Email Address Date Last Time Financial Plans Edited Date the Resource last made a Financial Plan edit Date of last entry on a Timesheet Date the Resource last made an entry on a timesheet Created Date Date the resource was added to the system Date of Hire Resource’s Date of Hire Date of Termination Resource’s Date of Termination Financial Department Resource’s Financial Department Home Page Resource’s Home Page Language Default Language of the Resource Primary role Resource’s Primary Role Resource manager Resource’s Manager Track Mode Resource’s Track Mode User Name Resource’s Username -
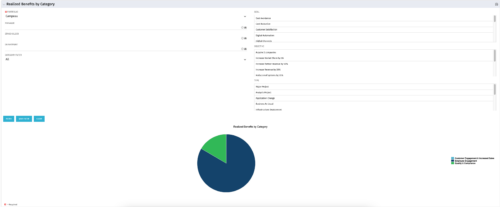 This is a pie chart portlet to show realized benefits across the system by category, including a category for no category or unspecified. Pie chart shows categories of realized benefits in its slices. Available filters:
- Portfolio (required)
- Manager
- Stakeholder
- Department
- Category Filter (default to all)
- Goal
- Objective
- Type
-
This is a pie chart portlet to show realized benefits across the system by category, including a category for no category or unspecified. Pie chart shows categories of realized benefits in its slices. Available filters:
- Portfolio (required)
- Manager
- Stakeholder
- Department
- Category Filter (default to all)
- Goal
- Objective
- Type
-
 This Portlet produces a Grid View of Resources using total Resource Allocation from each Project’s Team / Staff, per month; output is expressed as a %. Users can specify which Resource OBS to use as a Filter (unit and descendants is assumed) as well as a Start/End Date.
 -
This Portlet produces a Grid View of Resources using total Resource Allocation from each Project’s Team / Staff, per month; output is expressed as a %. Users can specify which Resource OBS to use as a Filter (unit and descendants is assumed) as well as a Start/End Date.
-
This Portlet produces a Grid View of Resources using total Resource Allocation from each Project’s Team / Staff, per month; output is expressed as a %. Users can specify which Resource OBS to use as a Filter (unit and descendants is assumed) as well as a Start/End Date.


Copyright 2023 • Rego Consulting Corporation • Privacy Policy