
| Column Label | Description |
| From | Who the email is coming from |
| Sent To | Individual users the message should send to |
| Send to Group | Security groups the message should send to (users within the security groups) |
| Message Project Team | Should this message be sent to a project team |
| Associated Investment | If Message Project Team is checked, which project should the team list be pulled from |
| Message Subject | Subject line of the email |
| Message Content | Body of the email (html) |
| Message date | Internal code used by the query |
-
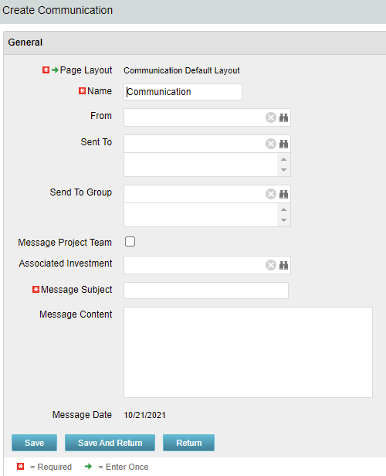 The Communications Object allows a user to send an html-based email to all users on a project, in a security group, or to individual users directly from Clarity. An email can be sent by creating a new entry on the Communication List page, upon saving a new entry the email process with trigger and send the email. Auto Start Solution: An email can be sent by creating a new entry on the Communication List page, upon saving a new entry the email process with trigger. On Demand Solution: All emails could be sent together as a broadcast communication by running the process manually from the Organizer. This process could also be scheduled to run on a specific time using Jobs The table below describes the available columns on the object.
Either of the on-demand process or auto start process should be active at a time. The package provides two Processes: 1. Send Notification (ID:rego_send_notification) This is an auto start process. The notification is sent immediately when a new entry is created on the Communication object. Only one email notification will be sent for one entry. Any updates to the same entry will not trigger any new notifications. 2. Email Communication (ID:rego_email_comm) This is an on-demand process that could be run from the Organizer. This send notification to all the entries on the Communication objects for which a communication was not already sent. This process does not have a Primary object. The processes are designed to work both in Oracle and Postgres environment. If the DB vendor information from Properties.xml is Postgres the SQL query for Postgres will be called. If not, the default SQL is Oracle. Important Note: Either of the processes should be active for an Implementation. If both the processes are active the on-demand process has no effect and will never send any communication. All object entries have a sent flag which will be marked whenever a notification is sent. Both the processes set the same flag on the object instance. Only with admin DB rights this flag could be overwritten. Object Name:Communication Object ID: rego_communication Flag Attribute Name: Sent (Id: rego_sent) -
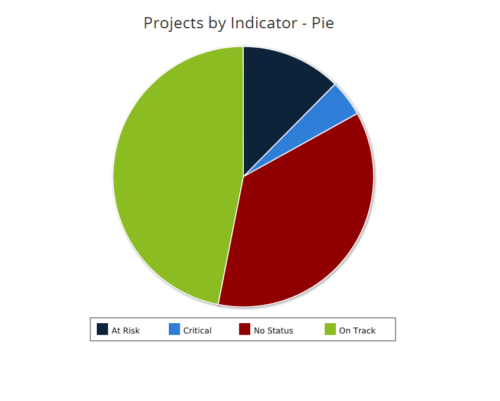 Projects by Status Indicator is a pie chart that displays count of projects by out of box Status Indicator attribute. Legend displays the colors associated with various Status Indicator values. Mouse over the pie chart slice displays the count of projects associated with that respective Status Indicator value. You can further narrow your search by OBS Path, Project Manager and Is Project Active?.
 -
 This portlet displays Actual Time by Project over a span of time. It supports Annual, Quarterly, Monthly, and Weekly time periods. The time span displayed is controlled by a filter field for the Start Date (of the time span) and by a filter field for the Number of Time Periods to be displayed. There are also filters for Project name, Project Manager, and Project Type.
 -
 Part of the Business Transformation Collection, this bubble-chart portlet displays investments per their alignment, status and total planned benefit. The: X-axis displays the alignment Y-axis displays the status Bubble-size displays the total planned benefit
 -
Part of the Business Transformation Collection, this bubble-chart portlet displays investments per their alignment, status and total planned benefit. The: X-axis displays the alignment Y-axis displays the status Bubble-size displays the total planned benefit
-
 The Financial Summary by Transaction Class - Graph provides a visual graph for each years financial picture beginning with current year and going forward into the future. It will show the user where they need to concentrate their efforts in order to meet financial commitments.
 -
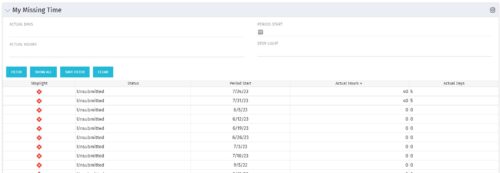 The My Missing Time portlet displays all open time periods for which the logged in user (assuming they are open for time entry with a track mode of Clarity) has a timesheet that is not posted (accommodates for hire and termination dates). The portlet is used as a quick reference for users to view their missing time.
 -
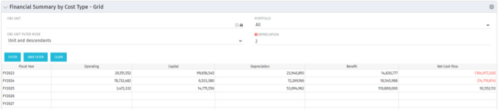 The Financial Summary by Cost Type - Grid is very beneficial as it provides actual numbers for each years financial picture beginning with current year and going forward into the future. It will show the user where they need to concentrate their efforts in order to meet financial commitments.
 -
The Financial Summary by Cost Type - Grid is very beneficial as it provides actual numbers for each years financial picture beginning with current year and going forward into the future. It will show the user where they need to concentrate their efforts in order to meet financial commitments.
-
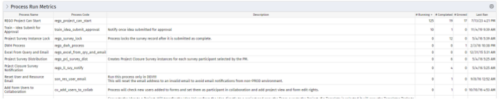 For each process, the Process Run Metrics portlet shows the Process Name, Process Code, Description, # Running, # Completed, # Errored, and Last Run Date. This portlet is ideal for system administrators and support staff needing to monitor the health of the environment. Viewers of this portlet can get a sense of the complexity & health of the environment with the # of processes running and visibility into processes that errored out. The table below describes the available filter fields in the portlet.
Column Label Description Process Name Name of the process Start Date Start date of the process’s last ran date End Date End date of the process’s last ran date Description Description of the process Process ID ID of the process -
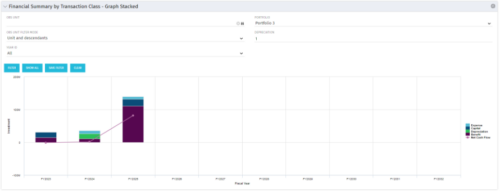 This stacked bar graph portlet displays the financial summary by transaction class for the current and future fiscal annual periods. Filters are provided for:
- OBS
- Portfolio
-
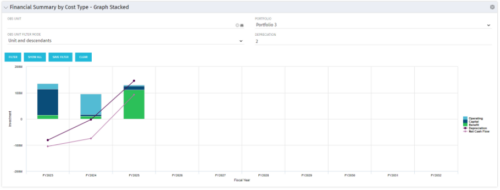 The Financial Summary by Cost Type - Graph Stacked provides a visual stacked graph for each years financial picture beginning with current year and going forward into the future. It will show the user where they need to concentrate their efforts in order to meet financial commitments.
