-
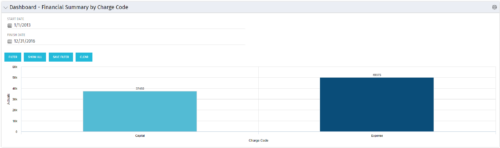 The Dashboard: Financial Summary by Charge Code portlet displays financial information from the project summarized by Charge Code. The portlet is added to the dashboard page of a project and will pull all actuals by charge code on the project. The user may filter by date range to narrow the results.
 -
The Dashboard: Financial Summary by Charge Code portlet displays financial information from the project summarized by Charge Code. The portlet is added to the dashboard page of a project and will pull all actuals by charge code on the project. The user may filter by date range to narrow the results.
-
 With every new PPM process, the organization must adopt change. Change is constant in an organization. This session will talk about keys to successfully leading change vs. just implementing change in your organization.
 -
 This training document is a Rego Consulting Quick Reference Guide to assist with the creation of Benefit Plans in Clarity’s Modern User Experience. This doc references version 16.1 views. Doc provides detail on how to create a Benefit Plan, how to categorize Benefit Class and Benefit Subclass, how to add financial values to your Benefit Plan, and how to add the Benefit Plan to your Cost Plan.
 -
 This training document is a Rego Consulting Quick Reference Guide to assist with General Navigation in Clarity’s Modern User Experience. This doc references version 16.1 views. Doc reviews the Menu Bar and User Tool Bar. Document provides instructions on how to access blueprints, create a new blueprint and edit the fields available on the blueprint. Detail is also provided on how to update the modules, rules and actions associated with a blueprint. Instructions are listed to show the user how to modify the create from template page, how to add a new channel and how to set a default blueprint. Tips on the user of the API Attribute ID are also provided.
 -
 This training document is a Rego Consulting Quick Reference Guide to assist with the management of project tasks from within the Tasks tab in Clarity’s Modern User Experience. This doc references version 16.1 views. Document covers Task Tab, Timeline View, Board View, Grid View, adding and removing columns, saving views, task details, To Dos, Assignments, Links, Conversations and View Options settings.
 -
 This training document is a Rego Consulting Quick Reference Guide to assist with the management of Project Tasks via the PPM Gantt view in Clarity’s Modern User Experience. This doc references version 16.1 views. Doc covers PPM Gantt, View Legend, Menu Icons, Create New Task, Indent Tasks, Move Tasks and Set Dependencies.
 -
 This training document is a Rego Consulting Quick Reference Guide to assist with the creation of financial plans within Ideas in Clarity’s Modern User Experience. This doc references version 16.1 views. Document includes instructions on how to create cost plans, budget plans and benefit plans.
 -
 This training document is a Rego Consulting Quick Reference Guide to assist with the creation and management of Ideas in Clarity’s Modern User Experience. This doc references version 16.1 views. Doc covers creation of ideas, adding columns to the grid view and editing existing ideas.
 -
 This training document is a Rego Consulting Quick Reference Guide to assist with Entering and Submitting Time in Clarity’s Modern User Experience. This doc references version 16.1 views. Document includes Accessing & Selecting Timesheets, Populate Timesheet, Updating Timesheet, Submitting Timesheet and Entering Time for Someone Else.
 -
 This training document is a Rego Consulting Quick Reference Guide to assist resource managers with the approval of timesheets via the Review & Approve tab. This doc references version 16.1 views. Doc reviews accessing and selecting timesheets, reviewing submitted timesheets, approving timesheets, approving multiple timesheets, returning timesheets and the timesheet grid.
 -
 This training document is a Rego Consulting Quick Reference Guide to assist with General Navigation in Clarity’s Modern User Experience. This doc references version 16.1 views. Doc reviews the Menu Bar and User Tool Bar.


Copyright 2023 • Rego Consulting Corporation • Privacy Policy