RegoXchange
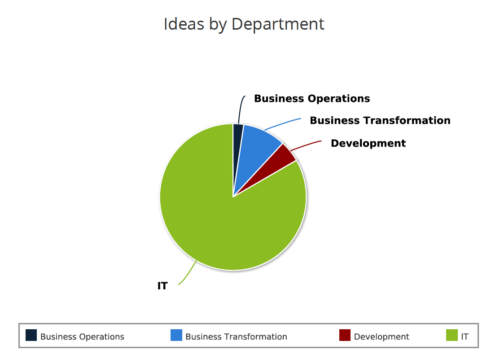
  • Ideas by Department report is a pie chart that displays count of ideas by department. Mouse over on the pie chart displays idea count for that department. You can further narrow your search by OBS Type & Path , Idea Status, Idea Start Date and  Is Idea Active?.
  • Pie Chart displays count of all Ideas by Department.  Filterable by Active and Inactive, by OBS, and by Department Manager.  Data label and mouse-over show department counts.  Legend displays department names.
  • Pie Chart displays count of all Ideas by Department.  Filterable by Active and Inactive, by OBS, and by Department Manager.  Data label and mouse-over show department counts.  Legend displays department names.
  • Pie Chart displays count of all Ideas by Department.  Filterable by Active and Inactive, by OBS, and by Department Manager.  Data label and mouse-over show department counts.  Legend displays department names.
  • This is a great way to review demand by type and evaluate where demand is coming from and who will be impacted. Displays a bar graph of all ideas group by type.
  • This is a great way to review demand by type and evaluate where demand is coming from and who will be impacted. Displays a bar graph of all ideas group by type.
  • This is a great way to review demand by type and evaluate where demand is coming from and who will be impacted. Displays a bar graph of all ideas group by type.
  • This is a great way to review demand by type and evaluate where demand is coming from and who will be impacted. Displays a bar graph of all ideas group by type. Provides the ability to drill down into a bar to see which ideas are part of the bar.
  • This is a great way to review demand by type and evaluate where demand is coming from and who will be impacted. Displays a bar graph of all ideas group by type. Provides the ability to drill down into a bar to see which ideas are part of the bar.
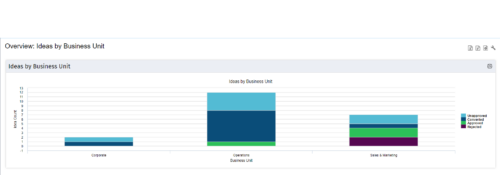
  • Ideas by Business Unit report is a pie chart that displays count of ideas per business unit. This report gives a holistic view of the idea pipeline in an Organization and provides information on number of ideas converted, approved & unapproved per business unit. You can further narrow your search by Idea Status, Ideas Start Date and Is Idea Active?.
  • Part of the Business Transformation Content collection, this bar chart portlet displays count of ideas per business unit. This provides a holistic view of the idea pipe-line in an organization providing them a high-level of ideas converted, approved, unapproved per business unit.
  • Part of the Business Transformation Content collection, this bar chart portlet displays count of ideas per business unit. This provides a holistic view of the idea pipe-line in an organization providing them a high-level of ideas converted, approved, unapproved per business unit.
Go to Top