- Change Requests
- Cost Trend
- Cost
- Effort Trend
- Effort
- Hierarchy Summary
- Investment Drill Thru
- Investment Gantt
- Issue Summary
- Milestones
- Risk Summary
- Staff
- Status Report Summary
- Tasks
-
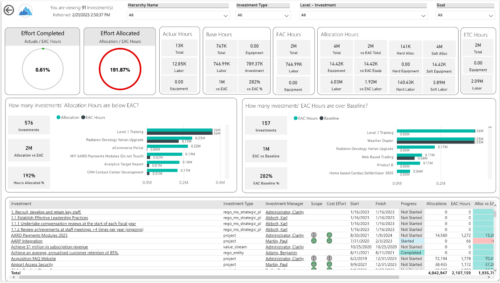
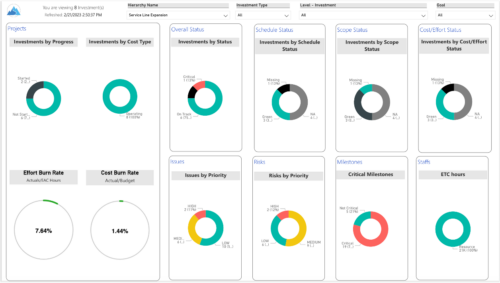 Summarize an ad hoc list of investments or leverage your defined hierarchies to visualize and evaluate the performance of your portfolios, including financial data analysis. Report Views include:
 -
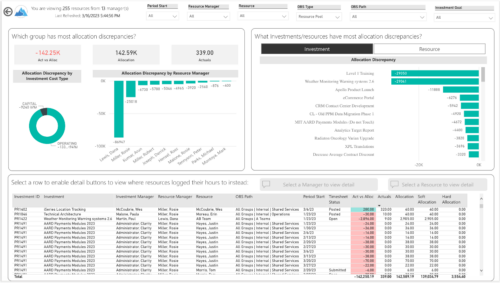
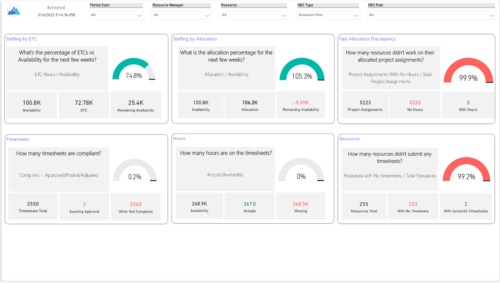 Evaluate resource allocations, identify bottlenecks, and ensure optimal resource utilization across projects and teams. Report Views include:
- Allocation Discrepancies
- Resource Detail
- Resource Skills
- Resource Summary
- Resource Tasks
- Staffing Allocations
- Staffing ETC
-
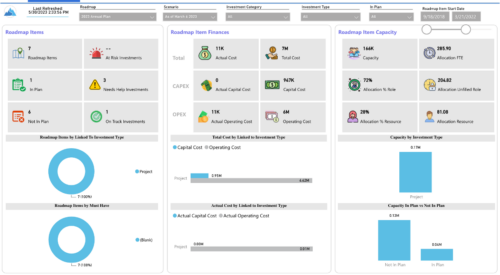
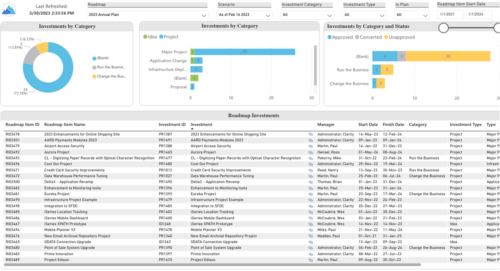 Plan your future work by comparing different scenarios, including in-flight work, and determine the best course of action for your organization. Report Views include:
- Roadmap Details
- Resource Investment Demand
- Roadmap Financials
- Roadmap Investment Gantt
- Roadmap Item Gantt
- Roadmap Overview – Default Scenarios
- Roadmap Overview – Single Roadmap Selection
- Scenario Comparison
-
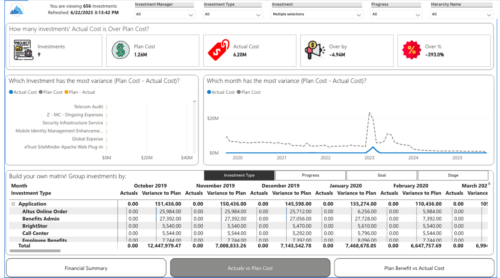
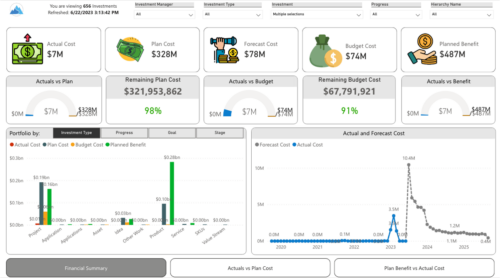 Gain a financial view of your investments by comparing actuals to planned cost and planned benefit. Report views include:
- Financial Summary
- Planned Benefit vs Actual Cost
- Actuals vs Planned Costs
-
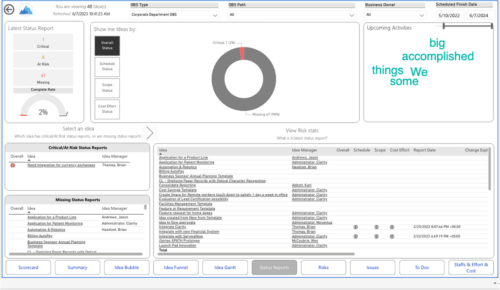
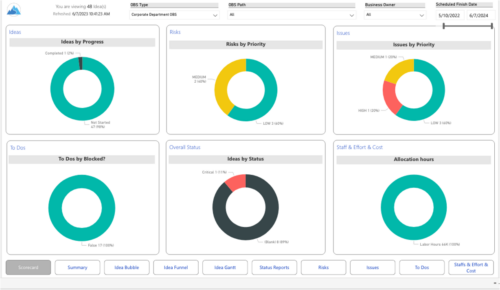 Master your pipeline as you prioritize, visualize, and analyze ideas, assess their feasibility, and track progress from inception to execution. Report Views include:
- Idea Bubble
- Idea Details
- Idea Funnel
- Idea Gantt
- Idea Overview
- Idea Staff and Effort
- Idea Status
- Idea To Dos
-
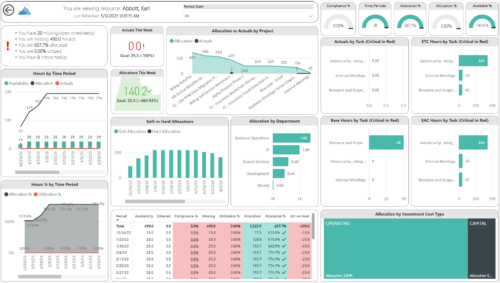
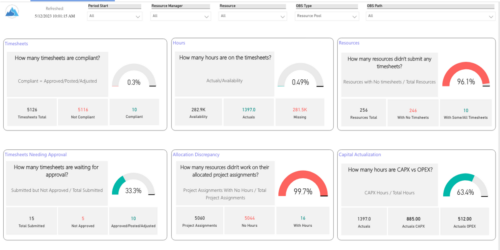 Spot opportunities to improve timesheet accuracy and resource allocations by assessing timesheet compliance and allocation. Report Views include:
- Allocation Variance
- Capex vs Opex
- Hours Detail
- Resource Dtails
- Single Manager Drill Down
- Single Resource Drill Down
- Timesheet Detail
- Timesheet Summary
- Unapproved Timesheets
-
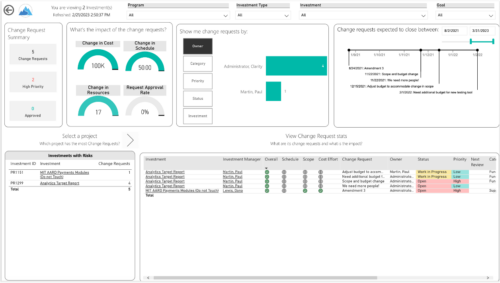
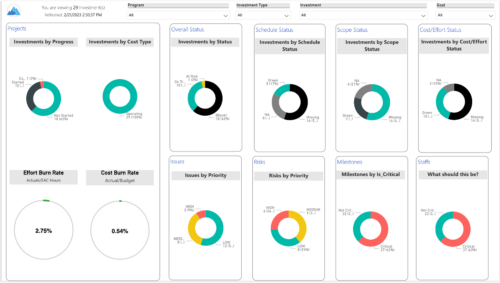 Gain an overview of program-level performance, track program milestones, and assess overall program health. Report Views include:
- Change Requests
- Program Costs Trend
- Program Costs
- Program Drill Thru
- Program Effort
- Program Gantt
- Program Issues
- Program Milestones
- Program Risks
- Program Staff
- Program Status Reports
- Program Summary
- Program Tasks
-
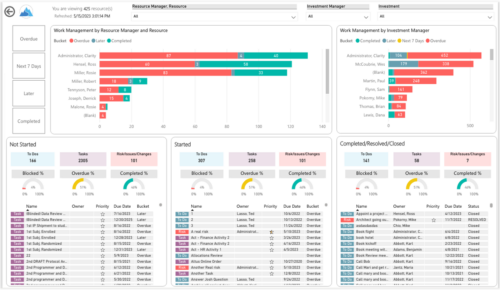
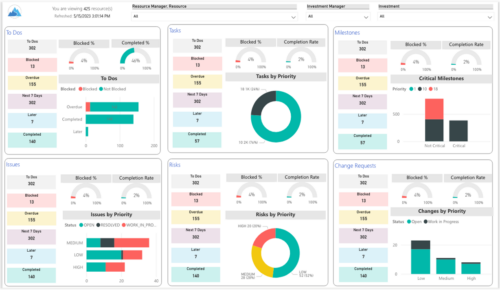 Make sure project deliverables are completed on time by tracking work progress and monitoring task assignments. Report Views include:
- Work Details
- Work Overview
- Work Risk Issue and Change
-
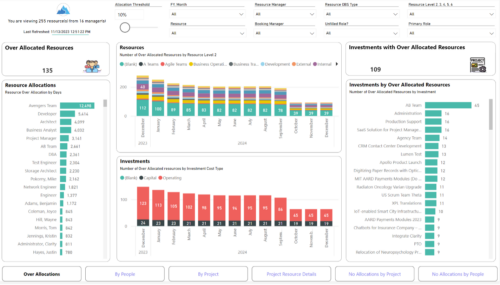
 Evaluate resource allocations, identify bottlenecks, and ensure optimal resource utilization across projects and teams. Report Views include: • Over Allocation • By Project • By People • Project Resource Details • No Allocations by Project • No Allocations by People The main .rpt file will access data through the Data Warehouse.
 -
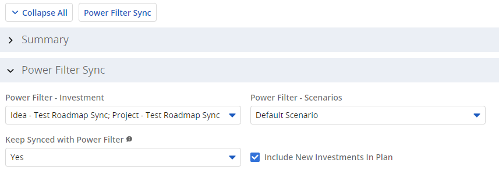 The Power Filter Sync functionality allows users to define rules for syncing investments to Roadmaps or Hierarchies on a scheduled (and on-demand in Roadmaps only) basis. Users may choose one or more saved views from investments that are allowed on the Roadmap/Hierarchy to define the list of investments they want that Roadmap/Hierarchy to contain. If the option to Keep Synced with Power Filter is set to Yes, then each time the process runs, the Investments returned by the saved views will be added to the Roadmap/Hierarchy if they don’t exist there already, and any investment not found in the saved views will be removed.
 -
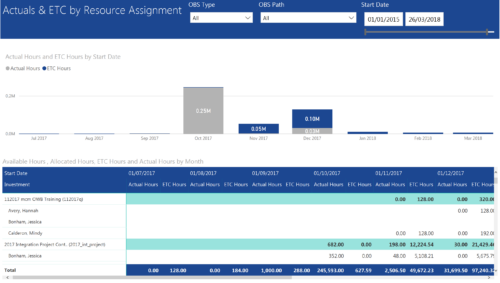 Actuals & ETC by Resource Assignment report provides project managers a single place to view Actuals and ETC associated with resources across multiple Tasks and Projects. It displays the following: Actual and ETC Hours by Start Date: Stacked Column chart that displays the total Actual hours and ETC hours per month of fiscal period. Grey color indicates Actuals and Purple indicates ETC hours during that month. Grid: Displays Investment name, Task, Assigned resource ETC and Actual hours per month of fiscal period. It also displays aggregated column and row totals for Actuals and ETC hours. You can further narrow your search by OBS Type, OBS Path & Start Date range.
 -
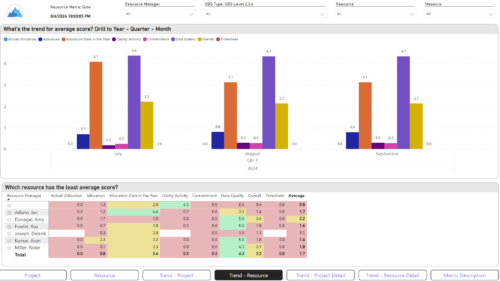
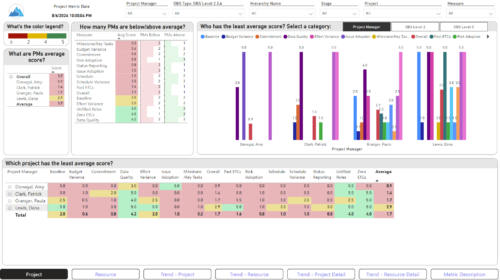 The Adoption Dashboard is designed to enhance data integrity and project tracking within Clarity by providing insights into how well users are populating and managing their project and resource data. Features: · Project Data Quality Evaluate the accuracy of project status reporting, risk, issue tracking, and schedule adherence. · Resource Data Quality Assess how well resource managers are managing timesheets, allocations, and actual utilization. · Adoption Scoring View Rate the consistency of data entry across projects and resources on a scale of 0-5, helping identify areas needing improvement. · Variance Analysis View Track discrepancies in project schedules, effort, budgets, and resource commitments. · Compliance Monitoring Ensure that all necessary project and resource data is up-to-date, aiding in more informed decision-making and better project outcomes.

