-
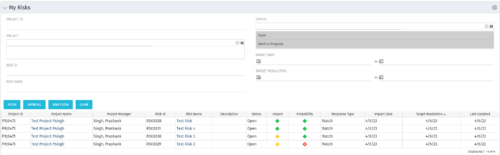 The My Risks portlet displays all risks related to active projects that the logged in user has been assigned as the owner. The portlet provides the logged in user a single place to view risks across multiple projects without having to go into each project individually. The filter then allows the user to narrow their search by Risk ID, Risk Name, Project ID, Project Name, and Risk Status. You may also narrow the view to display issues with a target resolution date or impact date within a certain date range.
 -
The My Risks portlet displays all risks related to active projects that the logged in user has been assigned as the owner. The portlet provides the logged in user a single place to view risks across multiple projects without having to go into each project individually. The filter then allows the user to narrow their search by Risk ID, Risk Name, Project ID, Project Name, and Risk Status. You may also narrow the view to display issues with a target resolution date or impact date within a certain date range.
-
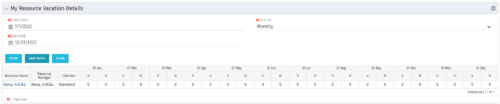 The My Resource Vacation Details portlet returns the logged in users calendar at a glance by week or month for a selected time period. It shows the Resource Name, Resource Manager, Calendar, H (holiday), and V (vacation) hours for the select time frame.
 -
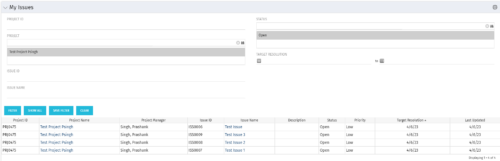 The My Issues portlet displays all issues within active project that the logged in user is assigned to. The portlet provides the logged in user a single place to view issues across multiple projects without having to go into each project individually. The filter then allows the user to narrow their search by Issue ID, Issue Name, Project ID, Project Name, and Issue Status. You may also narrow the view to display issues with a target resolution date within a certain date range.
 -
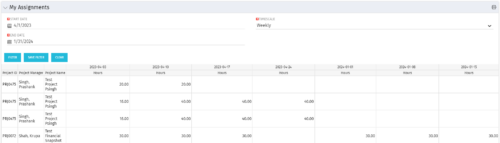 The My Assignments portlet will display the assignments for the logged in user - pulling data from the timeslices. It is used as a quick reference for the users to view their assignments across all of the projects. The portlet also displays work posted against the task, expressed in Actuals, and remaining work to be done, expressed as an Estimate to Complete (ETC). The Effort Variance reflects what the ETC variance is compared to the last current baseline of the project.
 -
The My Assignments portlet will display the assignments for the logged in user - pulling data from the timeslices. It is used as a quick reference for the users to view their assignments across all of the projects. The portlet also displays work posted against the task, expressed in Actuals, and remaining work to be done, expressed as an Estimate to Complete (ETC). The Effort Variance reflects what the ETC variance is compared to the last current baseline of the project.
-
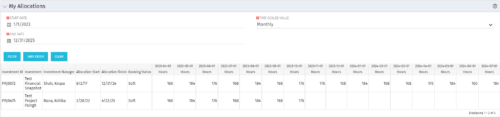 The My Allocations portlet will display the allocations for the logged in user - pulling data from the timeslices. It is used as a quick reference for the users to view their allocations across all of the projects where their allocation is greater than 0 for the specified date range the user wants. This will display both active and inactive projects.
 -
The My Allocations portlet will display the allocations for the logged in user - pulling data from the timeslices. It is used as a quick reference for the users to view their allocations across all of the projects where their allocation is greater than 0 for the specified date range the user wants. This will display both active and inactive projects.
-
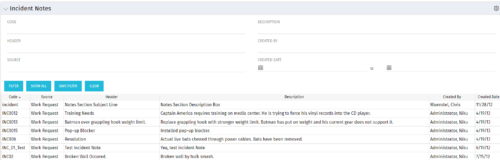 The Incident Notes portlet displays all of the notes that have been entered against Incidents in a single view. This allows users to more efficiently look at the notes, regardless of security rights, without having to enter each incident individually to view them.
 -
The Incident Notes portlet displays all of the notes that have been entered against Incidents in a single view. This allows users to more efficiently look at the notes, regardless of security rights, without having to enter each incident individually to view them.
-
 The Capacity Graph portlet displays Availability, Allocations, Actuals and Assignments for a Clarity user in a single view. This portlet pulls data from timeslices, and allows the user to filter on a weekly, monthly or quarterly data. The Estimated Time to Complete (ETC) and Allocation data will only show for projects that are active. This portlet provides a Clarity user with a simple way to analyse their: Allocations vs. Availability, Allocations vs. Actuals, Allocations vs. ETC and ETC vs. Availability. The graph allows the user to determine where areas of improvement may exist and quickly identify potential areas of constraint.
 -
The Capacity Graph portlet displays Availability, Allocations, Actuals and Assignments for a Clarity user in a single view. This portlet pulls data from timeslices, and allows the user to filter on a weekly, monthly or quarterly data. The Estimated Time to Complete (ETC) and Allocation data will only show for projects that are active. This portlet provides a Clarity user with a simple way to analyse their: Allocations vs. Availability, Allocations vs. Actuals, Allocations vs. ETC and ETC vs. Availability. The graph allows the user to determine where areas of improvement may exist and quickly identify potential areas of constraint.


Copyright 2023 • Rego Consulting Corporation • Privacy Policy