-
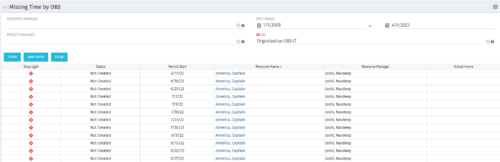 The Missing Time by OBS portlet displays all missing or late timesheets for resources staffed within a specific OBS. Resources will be included if they are open for time entry, have the track mode of ‘Clarity’ and have a timesheet that is not posted. The portlet accommodates for hire and termination dates. Also, the portlet only shows resources that the active user has the security rights to view. Administrators and the Project Management Office may use this portlet to determine the timesheet status of all resources within a specific OBS in open time periods. This portlet allows a user to quickly search by OBS and view all timesheets under that area. After selecting the OBS, the user can also filter on time period start date, Resource Manager and/or Project Manager. The portlet will display a ‘Stop Light’ indicator based on timesheet status, the status, period start, Resource Name, Resource Manager and any actual hours entered for the timesheet.
 -
The Missing Time by OBS portlet displays all missing or late timesheets for resources staffed within a specific OBS. Resources will be included if they are open for time entry, have the track mode of ‘Clarity’ and have a timesheet that is not posted. The portlet accommodates for hire and termination dates. Also, the portlet only shows resources that the active user has the security rights to view. Administrators and the Project Management Office may use this portlet to determine the timesheet status of all resources within a specific OBS in open time periods. This portlet allows a user to quickly search by OBS and view all timesheets under that area. After selecting the OBS, the user can also filter on time period start date, Resource Manager and/or Project Manager. The portlet will display a ‘Stop Light’ indicator based on timesheet status, the status, period start, Resource Name, Resource Manager and any actual hours entered for the timesheet.
-
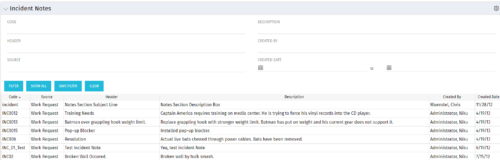 The Incident Notes portlet displays all of the notes that have been entered against Incidents in a single view. This allows users to more efficiently look at the notes, regardless of security rights, without having to enter each incident individually to view them.
 -
The Incident Notes portlet displays all of the notes that have been entered against Incidents in a single view. This allows users to more efficiently look at the notes, regardless of security rights, without having to enter each incident individually to view them.
-
The Incident Notes portlet displays all of the notes that have been entered against Incidents in a single view. This allows users to more efficiently look at the notes, regardless of security rights, without having to enter each incident individually to view them.
-
 The Capacity Graph portlet displays Availability, Allocations, Actuals and Assignments for a Clarity user in a single view. This portlet pulls data from timeslices, and allows the user to filter on a weekly, monthly or quarterly data. The Estimated Time to Complete (ETC) and Allocation data will only show for projects that are active. This portlet provides a Clarity user with a simple way to analyse their: Allocations vs. Availability, Allocations vs. Actuals, Allocations vs. ETC and ETC vs. Availability. The graph allows the user to determine where areas of improvement may exist and quickly identify potential areas of constraint.
 -
The Capacity Graph portlet displays Availability, Allocations, Actuals and Assignments for a Clarity user in a single view. This portlet pulls data from timeslices, and allows the user to filter on a weekly, monthly or quarterly data. The Estimated Time to Complete (ETC) and Allocation data will only show for projects that are active. This portlet provides a Clarity user with a simple way to analyse their: Allocations vs. Availability, Allocations vs. Actuals, Allocations vs. ETC and ETC vs. Availability. The graph allows the user to determine where areas of improvement may exist and quickly identify potential areas of constraint.
-

 The Capacity Graph portlet displays Availability, Allocations, Actuals and Assignments for one or more active resource(s) in a single view. This portlet pulls data from timeslices, and allows the user to filter on a weekly, monthly or quarterly data. The Estimated Time to Complete (ETC) and Allocation data will only show for projects that are active. This portlet provides Resource Managers, PMOs and Executives with a simple way to analyse: Allocations vs. Availability, Allocations vs. Actuals, Allocations vs. ETC and ETC vs. Availability. The graph allows the user to determine where areas of improvement may exist and quickly identify potential areas of constraint. Note: the information displayed is dependent on what the user has security rights to view.
 -
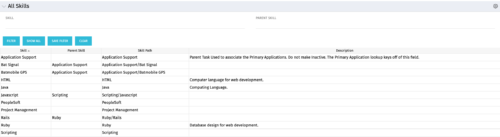 The All Skills portlet displays active skills available in the skills hierarchy, thus providing visibility to these values, without requiring administrative rights to be granted to the user. Viewing the skills list together in one view will allow the user to easily determine which skills they wish to add to their profile. The user may filter by Skill Name, or for skills associated with a particular parent skill.
 -
The All Skills portlet displays active skills available in the skills hierarchy, thus providing visibility to these values, without requiring administrative rights to be granted to the user. Viewing the skills list together in one view will allow the user to easily determine which skills they wish to add to their profile. The user may filter by Skill Name, or for skills associated with a particular parent skill.
-
The All Skills portlet displays active skills available in the skills hierarchy, thus providing visibility to these values, without requiring administrative rights to be granted to the user. Viewing the skills list together in one view will allow the user to easily determine which skills they wish to add to their profile. The user may filter by Skill Name, or for skills associated with a particular parent skill.


Copyright 2023 • Rego Consulting Corporation • Privacy Policy