-
 This training document is a Rego Consulting Quick Reference Guide to assist with Entering and Submitting Time in Clarity’s Modern User Experience. This doc references version 16.0.2 views. Document includes Accessing & Selecting Timesheets, Populate Timesheet, Updating Timesheet, Submitting Timesheet and Entering Time for Someone Else.
 -
 This training document is a Rego Consulting Quick Reference Guide to assist with Entering and Submitting Time in Clarity’s Modern User Experience. This doc references version 16.0.3 views. Document includes Accessing & Selecting Timesheets, Populate Timesheet, Updating Timesheet, Submitting Timesheet and Entering Time for Someone Else.
 -
 This training document is a Rego Consulting Quick Reference Guide to assist with Entering and Submitting Time in Clarity’s Modern User Experience. This doc references version 16.1 views. Document includes Accessing & Selecting Timesheets, Populate Timesheet, Updating Timesheet, Submitting Timesheet and Entering Time for Someone Else.
 -
 This training document is a Rego Consulting Quick Reference Guide to assist with Entering and Submitting Time in Clarity’s Modern User Experience. This doc references version 16.1.2 views. Document includes Accessing & Selecting Timesheets, Populate Timesheet, Updating Timesheet, Submitting Timesheet and Entering Time for Someone Else.
 -
 This training document is a Rego Consulting Quick Reference Guide to assist with Entering and Submitting Time in Clarity’s Modern User Experience. This doc references version 16.2.1 views. Document includes Accessing & Selecting Timesheets, Populate Timesheet, Updating Timesheet, Submitting Timesheet and Entering Time for Someone Else.
 -
 This training document is a Rego Consulting Quick Reference Guide to assist with Entering and Submitting Time in Clarity’s Modern User Experience. This doc references version 16.3 views. Document includes Accessing & Selecting Timesheets, Populate Timesheet, Updating Timesheet, Submitting Timesheet and Entering Time for Someone Else.
 -
 The Rego PowerBI Reporting Suite features close to 100 free PowerBI reports, designed to enhance project management and reporting capabilities.
 -
 Have you looked in the regoXchange or reviewed Rego’s innovation offerings? This class will show you the power of Rego’s pre-built content library, integrations, and other assets. See example after example of portlets, processes, and materials you can use to add value to your instance of Clarity. Learn how you can introduce email-based approvals with Rego's action item responder. Get a peek at Rego's new MSP integration that avoids the issues faced with the OOTB integration. Finally, understand Rego's pre-built connectors and how they can benefit your instance. Including blueprint migrator. Include free tools like GEL builder, query, XOGbridge.
 -
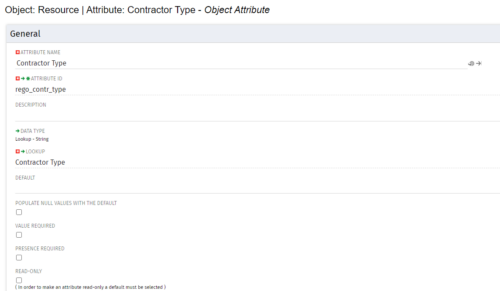
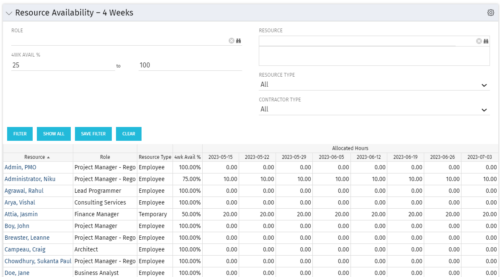 Resource Availability – 4 Weeks is a grid portlet that displays all resources with their total allocated hours by week, and an average availability percent (4 Wk Avail %) for next four weeks. If % Available is negative, this indicates an over-allocation. Zero% Average Availability indicates fully allocated (no remaining availability). Filterable by Role, Resource, Resource Type, Full-Time/Part-Time, Availability Range. Contractor Type is a custom attribute (Lookup - String) created on the Resource object. It is attached to the lookup, Contractor Type (Lookup ID: REGO_CONTRACTOR_TYPE) that has static values Part Time (PT) and Full Time(FT).
 -
Resource Availability – 4 Weeks is a grid portlet that displays all resources with their total allocated hours by week, and an average availability percent (4 Wk Avail %) for next four weeks. If % Available is negative, this indicates an over-allocation. Zero% Average Availability indicates fully allocated (no remaining availability). Filterable by Role, Resource, Resource Type, Full-Time/Part-Time, Availability Range. Contractor Type is a custom attribute (Lookup - String) created on the Resource object. It is attached to the lookup, Contractor Type (Lookup ID: REGO_CONTRACTOR_TYPE) that has static values Part Time (PT) and Full Time(FT).
-
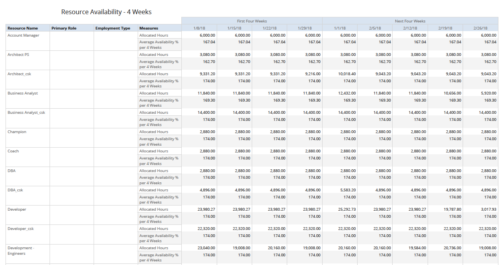 Resource Availability – 4 Weeks displays all resources with their total allocated hours by week, and an average availability percent (4 Wk Avail %) for next four weeks. This report also displays Resource Primary Role and Employment Type. User can further narrow their search by Resource Name, Resource Type & Week Start Date. User can use exact dates or relative dates for Week Start Date filter parameters.
 -
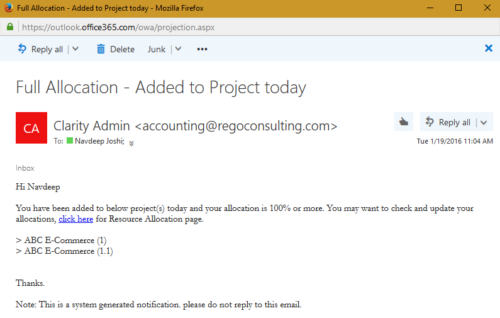 The process notifies resource who has been added to investment today and allocation is greater or equal to 100%. The process is on-demand and would require the user to have appropriate rights to run the process. Process should be scheduled as daily once job.
 -
The process notifies resource who has been added to investment today and allocation is greater or equal to 100%. The process is on-demand and would require the user to have appropriate rights to run the process. Process should be scheduled as daily once job.
-
 The Resource Time Review by Manager report provides visibility into timesheet entries for each resource, organized by investment manager or resource manager. It details hours entered by day and in total for each investment and time entry, helping managers monitor time allocation and utilization across their teams. This report supports effective oversight of resource effort and project participation.
 -
 The Resource Time Summary and Detail report provides insight into timesheet hours and notes for each resource across selected time periods. Data can be grouped by resource manager, time period, or any OBS level to support flexible analysis. Interactive visuals allow easy tracking, monitoring, and review of resource time allocation.
 -
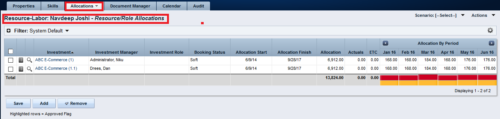
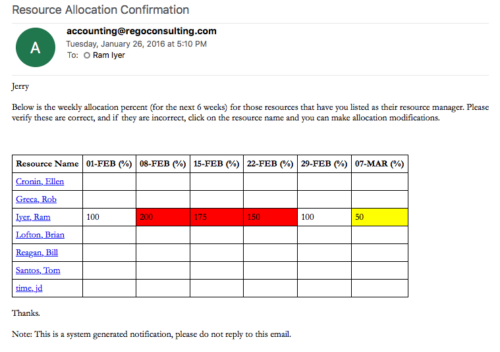 Process sends an email to RM, for resources assigned, that indicates the allocation percentage for each resource for the next 6 weeks. Email has links to each resource so that allocation modifications can be made as required.
 -
Process sends an email to RM, for resources assigned, that indicates the allocation percentage for each resource for the next 6 weeks. Email has links to each resource so that allocation modifications can be made as required.
-
Process sends an email to RM, for resources assigned, that indicates the allocation percentage for each resource for the next 6 weeks. Email has links to each resource so that allocation modifications can be made as required.
-
 Course description: “Is there a way to simplify time tracking? Time is a function 90% of companies use. What are ways to have time be less of a burden to users? How can you minimize the negative perception? This session will discuss options within CA PPM or outside CA PPM to make time tracking less of a burden for all.” Download file is the presentation slide deck.
 -
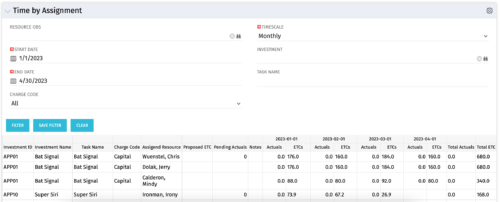 The Time by Assignment portlet displays time logged to assignments for all investments the logged in user has security rights to view - pulling data from the timeslices. It is capable of displaying the data by weekly, monthly or quarterly segments. The portlet may also be filtered by investment and resource OBS.
 -
The Time by Assignment portlet displays time logged to assignments for all investments the logged in user has security rights to view - pulling data from the timeslices. It is capable of displaying the data by weekly, monthly or quarterly segments. The portlet may also be filtered by investment and resource OBS.
-
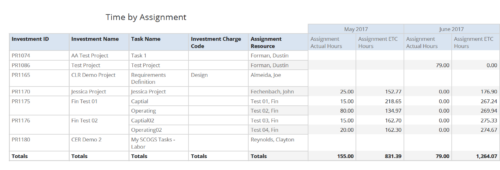 Time by Assignment report displays time logged to assignments and its associated actuals on monthly basis for all filtered investments. It also displays total ETC and Actual hours associated with an assignment. User can further narrow their search by OBS Type & Path, Investment Type, Investment Charge Code, Investment Name, Task Name, Resource Name, Assignment Start Date and Assignment Finish Date. User can use exact dates or relative dates for Assignment Start and Finish Dates filter parameters.
 -
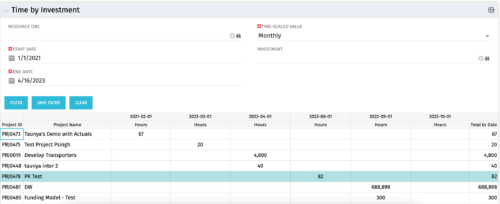
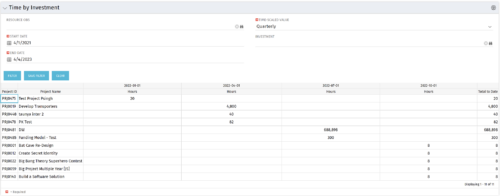 The Time by Investment portlet displays time logged to investments for all investments the logged in user has security rights to view using data from timeslices. It is capable of displaying the data by annual, quarterly, monthly, weekly, and daily segments with totals per date also being presented. The portlet may can be filtered by investment, resource OBS, and time segments. This portlet can be used as a management and governance tool to review aggregate hours posted to investments by time period.
 -
The Time by Investment portlet displays time logged to investments for all investments the logged in user has security rights to view using data from timeslices. It is capable of displaying the data by annual, quarterly, monthly, weekly, and daily segments with totals per date also being presented. The portlet may can be filtered by investment, resource OBS, and time segments. This portlet can be used as a management and governance tool to review aggregate hours posted to investments by time period.
-
 Time by Investment report displays time spent by resources on investment(s). User can view only the investments that he has access to view. Information can be drilled to Yearly, Quarterly or Monthly level. User can further narrow their search by OBS Type & Path, Investment Name, Month Start Date and Is Project Active?.
 -
 This portlet displays Actual Time by Project over a span of time. It supports Annual, Quarterly, Monthly, and Weekly time periods. The time span displayed is controlled by a filter field for the Start Date (of the time span) and by a filter field for the Number of Time Periods to be displayed. There are also filters for Project name, Project Manager, and Project Type.
 -
This portlet displays Actual Time by Project over a span of time. It supports Annual, Quarterly, Monthly, and Weekly time periods. The time span displayed is controlled by a filter field for the Start Date (of the time span) and by a filter field for the Number of Time Periods to be displayed. There are also filters for Project name, Project Manager, and Project Type.
-
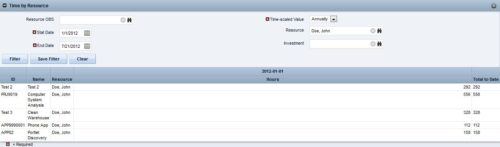
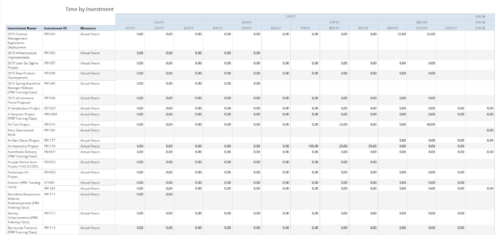
 This portlet displays the actual hours resources entered against investments. The per-period actual hours can be showed in days, weeks, months, quarters, or years. The data can be filtered by Resource, Resource Manager, OBS Unit, Investment and time period
 -
This portlet displays the actual hours resources entered against investments. The per-period actual hours can be showed in days, weeks, months, quarters, or years. The data can be filtered by Resource, Resource Manager, OBS Unit, Investment and time period
-
This portlet displays the actual hours resources entered against investments. The per-period actual hours can be showed in days, weeks, months, quarters, or years. The data can be filtered by Resource, Resource Manager, OBS Unit, Investment and time period
-
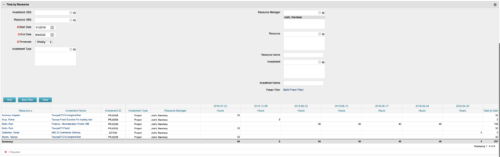
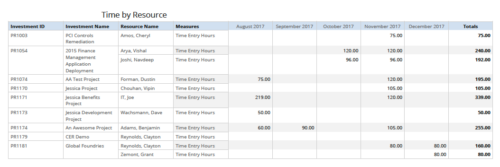 Time by resource is a grid report that provides resource and project managers a single place to view time logged to projects by resource over a period of time. This report provides information such as Investment ID, Investment Name, Resource Name and Time Logged Hours on period basis. Report provides you the flexibility of changing period type to Year, Quarter, Month and Day. You can further narrow your search by OBS Type & Path, Resource Name, Investment Name, Period Start Date and Is Investment Active?


Copyright 2023 • Rego Consulting Corporation • Privacy Policy