-
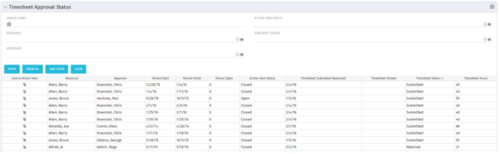 Portlet to show the stage of any Action Item triggered by Timesheet submission. Portlet allows for a period start date input, filters by Resource, Approver, Action Item Status and Timesheet Status. A link to the action item is provided for direct action by review if needed. This portlet is only for the clients who have established a process that triggers on Timesheet Status change to Submitted and to send Action Items to the person responsible for timesheet approval/validation i.e. PM for project tracking and/or RM for overall approval of the timesheet. The portlet won’t display any data if there are no timesheet Action Items. Examples of such processes would be CA’s OOTB Project Manager Approval or the Timesheet Approval - PM and RM process found on RegoXchange.
 -
Portlet to show the stage of any Action Item triggered by Timesheet submission. Portlet allows for a period start date input, filters by Resource, Approver, Action Item Status and Timesheet Status. A link to the action item is provided for direct action by review if needed. This portlet is only for the clients who have established a process that triggers on Timesheet Status change to Submitted and to send Action Items to the person responsible for timesheet approval/validation i.e. PM for project tracking and/or RM for overall approval of the timesheet. The portlet won’t display any data if there are no timesheet Action Items. Examples of such processes would be CA’s OOTB Project Manager Approval or the Timesheet Approval - PM and RM process found on RegoXchange.
-
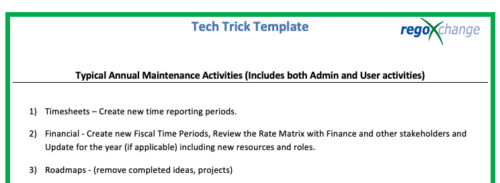 This is a list of 12 typical maintenance items that should be completed for Clarity on an annual basis. There is also a short list of items that should be completed periodically depending on client policies.
 -
 This training document is a Rego Consulting Quick Reference Guide to assist with Time Entry Administration Settings for Timesheets. This doc references version 16.0.3 views. Document provides detail on Timesheet Options for the Modern UX and how to enable end user column configuration. Detail is also provided on how end users may configure their timesheet view.
 -
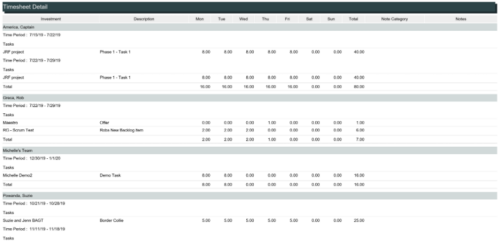 The Timesheet Detail report is a transaction based Jaspersoft report that does not require the Load Jaspersoft Datawarehouse job to be run. The report will pull real-time data from the transaction tables in Clarity. This report can be run from either the Advanced Reporting or Reports and Jobs area within Clarity. The Timesheet Detail report displays timesheet entries for a resource and time period. The timesheet entries include tasks, other time, incidents, and indirect time. The report shows the timesheet hours by day and in total, with any notes related to the time entry.
 -
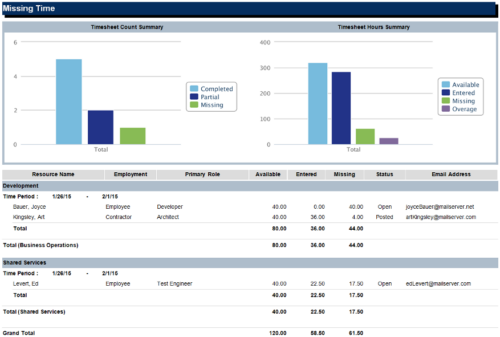 The Missing Time report is a transaction based Jaspersoft report that does not require the Load Jaspersoft Datawarehouse job to be run. The report will pull real-time data from the transaction tables in Clarity. This report can be run from either the Advanced Reporting or Reports and Jobs area within Clarity. The Missing Time report displays resource available hours, timesheet hours entered, and timesheet hours missing by resource and time period. The report can be grouped by resource manager or OBS level. The report also has an option to calculate missing time based on timesheet status or resource availability. The charts include a summary of timesheets across the periods included in the report. The Timesheet Count Summary displays the number of timesheets that are completed, partially completed, or missing for the time periods. The Timesheet Hours Summary displays the number of hours grouped by resource availability, timesheets entered, timesheets missing, and overage.
 -
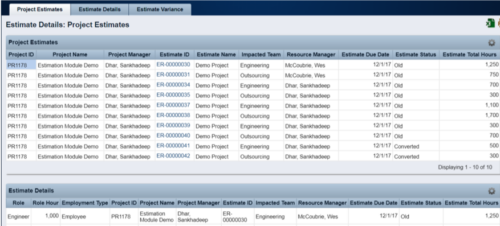 The Rego Estimation Module Provides a more accurate estimate earlier in the idea/project lifecycle.
- Is applied consistently so it can be improved.
- Retains the data in Clarity to enable analysis.
- Provides ongoing feedback by comparing estimates to current EAC.
- Provides historical record of estimating for projects overall as well as change requests.
-
The Rego Estimation Module Provides a more accurate estimate earlier in the idea/project lifecycle.
- Is applied consistently so it can be improved.
- Retains the data in Clarity to enable analysis.
- Provides ongoing feedback by comparing estimates to current EAC.
- Provides historical record of estimating for projects overall as well as change requests.
-
 This portlet pulls back the Availability and Allocation totals by Role between a user-specified Start and Finish Date, then the user can drilldown to look at the information for Applications. The Time Period filter allows for comparing these values across different timeframes (monthly, weekly, quarterly, annual) as desired. Other filters allow for looking at Active or Inactive Roles (or both) and including Active or Inactive Projects (or both) in the totals.
 -
This portlet pulls back the Availability and Allocation totals by Role between a user-specified Start and Finish Date, then the user can drilldown to look at the information for Applications. The Time Period filter allows for comparing these values across different timeframes (monthly, weekly, quarterly, annual) as desired. Other filters allow for looking at Active or Inactive Roles (or both) and including Active or Inactive Projects (or both) in the totals.
-
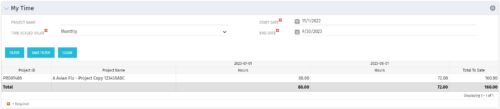 The My Time portlet provides the logged in user with the ability to view his or her time by project by time period without having to go into each period individually on the Timesheets page. This portlet uses the actual timeslices to retrieve data. It displays the amount of time worked per week, month or quarter on projects. The user may specify the dates, time-scaled value and the project name. The portlet also provides a Total to Date, which shows the total number of actuals for that resource on that assignment.
 -
The My Time portlet provides the logged in user with the ability to view his or her time by project by time period without having to go into each period individually on the Timesheets page. This portlet uses the actual timeslices to retrieve data. It displays the amount of time worked per week, month or quarter on projects. The user may specify the dates, time-scaled value and the project name. The portlet also provides a Total to Date, which shows the total number of actuals for that resource on that assignment.
-
 This training document is a Rego Consulting Quick Reference Guide to assist with Entering and Submitting Time in Clarity’s Modern User Experience. This doc references version 16.0.3 views. Document includes Accessing & Selecting Timesheets, Populate Timesheet, Updating Timesheet, Submitting Timesheet and Entering Time for Someone Else.
 -
 This training document is a Rego Consulting Quick Reference Guide to assist resource managers with the approval of timesheets via the Review & Approve tab. This doc references version 16.0.3 views. Doc reviews accessing and selecting timesheets, reviewing submitted timesheets, approving timesheets, approving multiple timesheets, returning timesheets and the timesheet grid.
 -
 This training document is a Rego Consulting Quick Reference Guide to assist resource managers with the adjusting of timesheets. This doc references version 16.0.3 views. Document provides guidance on how to use the Review & Approve tab to adjust time that has already been entered by a resource.
 -
 This training document is a Rego Consulting Quick Reference Guide to assist with Entering and Submitting Time in Clarity’s Modern User Experience. This doc references version 16.0.2 views. Document includes Accessing & Selecting Timesheets, Populate Timesheet, Updating Timesheet, Submitting Timesheet and Entering Time for Someone Else.
 -
 This training document is a Rego Consulting Quick Reference Guide to assist resource managers with the approval of timesheets via the Review & Approve tab. This doc references version 16.0.2 views. Doc reviews accessing and selecting timesheets, reviewing submitted timesheets, approving timesheets, approving multiple timesheets, returning timesheets and the timesheet grid.
 -
 This training document is a Rego Consulting Quick Reference Guide to assist with Time Entry Administration Settings for Timesheets. This doc references version 16.0.2 views. Document provides detail on Timesheet Options for the Modern UX and how to enable end user column configuration. Detail is also provided on how end users may configure their timesheet view.
 -
 This training document is a Rego Consulting Quick Reference Guide to assist resource managers with the adjusting of timesheets. This doc references version 16.0.2 views. Document provides guidance on how to use the Review & Approve tab to adjust time that has already been entered by a resource.
 -
 This training document is a Rego Consulting Quick Reference Guide to assist with timesheet approval in Clarity’s Modern UX. The doc reviews Accessing and Selecting Timesheets, Reviewing Submitted Timesheets, Approving Timesheets, Returning Timesheets and the Timesheet Grid.
 -
 This training document is a Rego Consulting Quick Reference Guide to assist Admins with Timesheet settings.
 -
 This training document is a Rego Consulting Quick Reference Guide to assist with adjustments to timesheet in Clarity’s Modern User Experience.
 -
 A slide deck that reviews the processes for time entry and approval of timesheets in Clarity’s Modern UX. Used for Rego’s training engagements, it covers the Time Entry process via flow chart, steps for submitting a timesheet, adjusting a returned timesheet, and adding or removing tasks from a timesheet.
 -
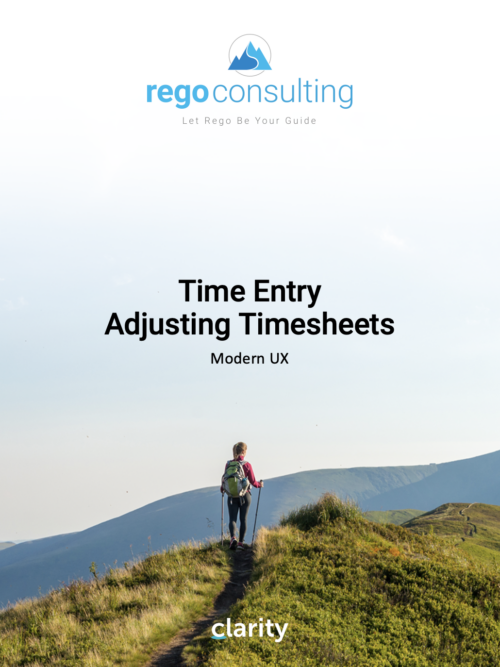
 The REGO Timesheets - WIP portlet displays timesheet information for timesheets that have a status of posted but have not been posted to the WIP tables. This does not include records hung up in invalid transactions. Users can further narrow their search by Project Name, Resource Name, Timesheet Status, Start Date, and Finish Date.
 -
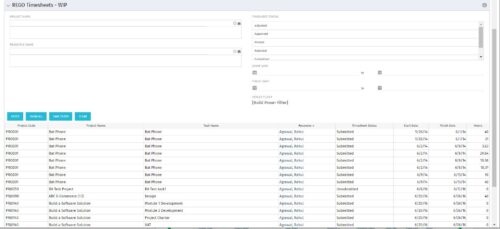
 This portlet provides a view into the number of timesheets that were expected to be completed for a specified time period(s) as well as the number of timesheets that were completed and the percent complete. This can also be filtered by OBS so that a company can see timesheet compliance at the OBS level.
 -
This portlet provides a view into the number of timesheets that were expected to be completed for a specified time period(s) as well as the number of timesheets that were completed and the percent complete. This can also be filtered by OBS so that a company can see timesheet compliance at the OBS level.
-
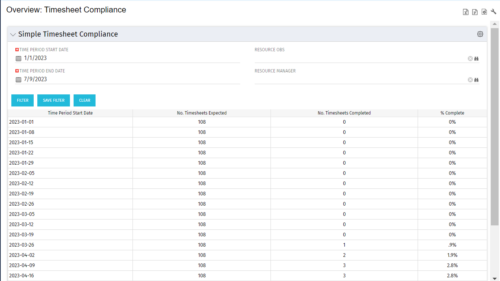
 Time by Investment report displays time spent by resources on investment(s). User can view only the investments that he has access to view. Information can be drilled to Yearly, Quarterly or Monthly level. User can further narrow their search by OBS Type & Path, Investment Name, Month Start Date and Is Project Active?.
 -
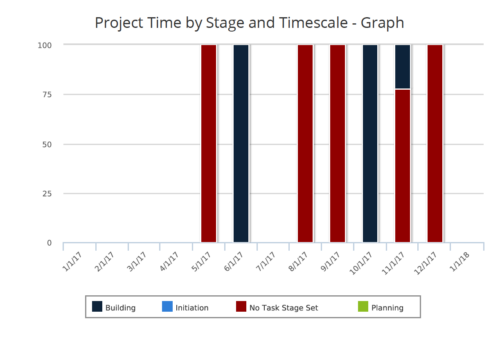 Time by Stage and Timescale – Graph report is a stacked column chart that displays hours for all tasks on projects by their stage for a user-defined time period. Using this report, Management can determine if excess time is being spent on a certain task stage within a project You can further narrow your search by Month Start Date, OBS Type & Path, Is Project Active? And Is Template?
 -
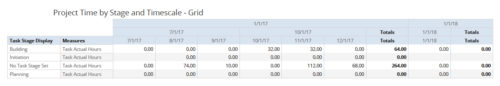 Time by Stage and Timescale – Grid report displays hours for all tasks on projects by their stage for a user-defined time period. Information can be drilled down to Year, Quarter or Monthly level. Using this report, Management can determine if excess time is being spent on a certain task stage within a project You can further narrow your search by Month Start Date, OBS Type & Path, Is Project Active? And Is Template?
 -
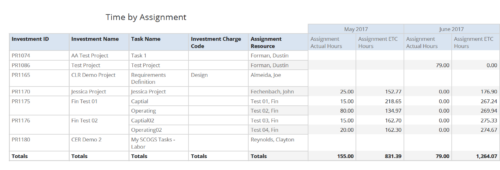 Time by Assignment report displays time logged to assignments and its associated actuals on monthly basis for all filtered investments. It also displays total ETC and Actual hours associated with an assignment. User can further narrow their search by OBS Type & Path, Investment Type, Investment Charge Code, Investment Name, Task Name, Resource Name, Assignment Start Date and Assignment Finish Date. User can use exact dates or relative dates for Assignment Start and Finish Dates filter parameters.
 -

Rego’s Clarity Adoption Metrics package consists of two sets of metrics: Project metrics, and Resource metrics. Project metrics measure how effectively project managers are using Clarity to manage their projects. Resource metrics measure how effectively resource managers are using Clarity to manage resources. Metrics are scored on a scale of 0 to 5, with higher scores indicating greater adoption and use. All metrics can be viewed numerically or graphically, and can be broken out by OBS. In addition, metric data can display as a 12-month rolling history to help identify trends. Project metrics can also display by lowest / highest adoption rates for a specific resource metric or all resource metrics. There is a variety of way to view the Adoption Metric data, therefore, Rego has made this simple by creating an Adoption Metrics object that contains multiple tabs. Each tab displays one or more of the Project or Resource Adoption Metrics. Based on the nature of the Metrics some tabs will allow the ability to use a pull down menu to select a specific Adoption Metric. There is also a Metrics trending view that pulls monthly snapshots of the metrics. Project metrics consist of the following: - Project Status Reporting – Measures how well PMs create and publish project status reports.
- Project Risk Adoption – Measures how well Risks are being used and managed.
- Project Issue Adoption – Measures how well Issues are being used and managed.
- Project Schedule – Measures how well PMs create tasks and keep the project schedule current.
- Project Baseline – Measures whether or not baselines exist.
- Project Zero ETC’s – Measures how well the PM assigns resources to tasks with ETCs.
- Project Past ETC’s – Measures how many improperly scheduled tasks the PM has.
- Project Milestone / Key Tasks – Measures how well PMs create and manage Milestones / Key Tasks.
- Project Schedule Variance – Measures how effectively PMs manage their schedules.
- Project Effort Variance – Measures how effectively PMs manage their project efforts.
- Project Budget Variance – Measures how effectively PMs manage budgets or cost plans.
- Project Unfilled Roles – Measures project roles with allocations that are already started or starting within the next 30 days.
- Project Data Quality – Measures how effectively PMs complete the Description, Stage, Progress, Objective, and Sponsor/Business Owner fields.
- Project Commitment – Measures the hard allocations for a project over a two week time frame.
- Resource Clarity Usage – Measures how often users log into Clarity.
- Resource Timesheet – Measures if timesheets post in a timely manner.
- Resource Allocation – Measures how well RMs keep total resource allocations within the expected range for future time periods.
- Resource Actualy Utilization – Measures how well Resource allocations match actuals.
- Resource Allocation Date in the Past – Measures how many resources are open for time entry with dates in the past.
- Resource Data Quality – Measures how well RMs complete the Resource Manager and Primary Role fields and optionally the Skill and Employment Type fields.
- Resource Commitment – Measures how much resource available time is committed to projects.


Copyright 2023 • Rego Consulting Corporation • Privacy Policy