-
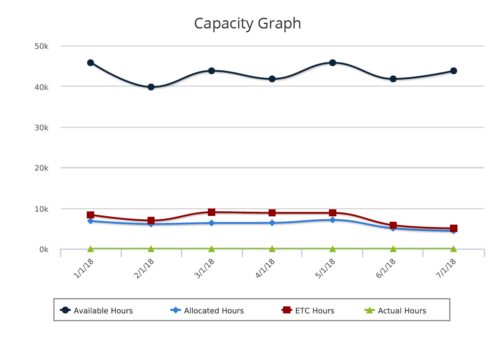 Capacity Graph report provides the Resource Managers & PMO a single place to view Monthly Availability, Allocations, Actuals and Assignments for one or more active resources. Information is displayed in the form of a line chart. Legend displays the color associated with each metric. Mouse over the line chart displays hours associated with that corresponding metric. This report provides Managers a simple means to analyze: Allocations vs. Availability, Allocations vs. Actuals, Allocations vs. ETC and ETC vs. Availability and helps in determining the areas of improvement. User can further narrow their search by OBS Type & Path, Month Start Date, Resource Name, Resource Manager, Primary Role & Employment Type.
 -
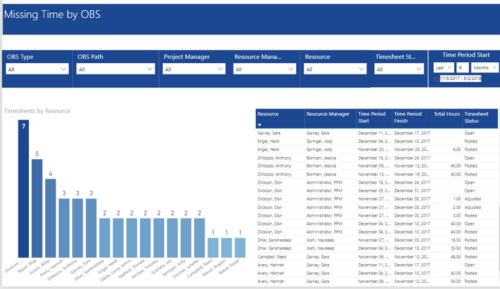 Missing Time by OBS report displays Resource whose timesheets are missed. There is Clustered Column Chart which displays Timesheets count by Resource. Also, there is table view of Resource, Resource Manager, Time Period Start and Finish Dates, Total Hours and Timesheet status. User can narrow their search by OBS Type & Path and Project Manager, Resource Manager, Resource, Timesheet Status and Time Period Start Date (Relative or Specific Date Range).
 -
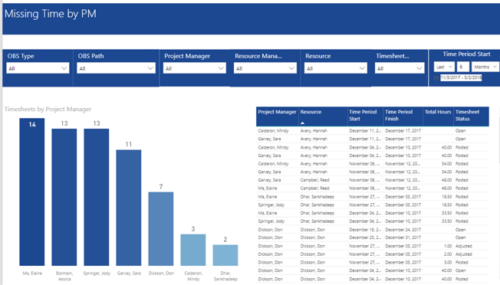 Missing Time by PM report displays Resources whose timesheets are missed by Project Manager. There is Clustered Column Chart which displays missed timesheets count by Project Manager. Also, there is table view of Project Manager, Resource, Time Period Start and Finish Dates, Total Hours and Timesheet status. User can narrow their search by OBS Type & Path and Project Manager, Resource Manager, Resource, Timesheet Status and Time Period Start Date (Relative or Specific Date Range).
 -
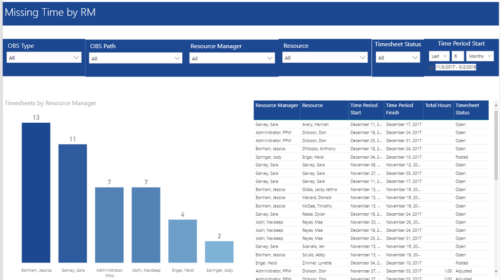 Missing Time by RM report displays Resources whose timesheets are missed by Resource Manager. There is Clustered Column Chart which displays missed timesheets count by Resource Manager. Also, there is table view of Resource Manager, Resource, Time Period Start and Finish Dates, Total Hours and Timesheet status. User can narrow their search by OBS Type & Path, Resource Manager, Resource, Timesheet Status and Time Period Start Date (Relative or Specific Date Range).
 -
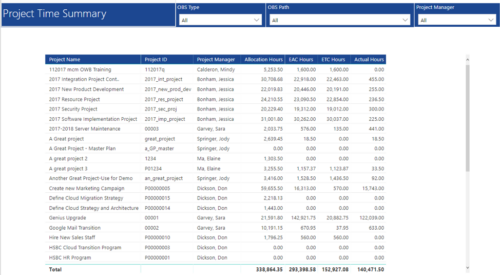 Project Time Summary report provides view of Allocation hours, EAC hours, ETC hours and Actual hours for Projects. User can further narrow their search by OBS Type & Path and Project Manager.
 -
 Actuals & ETC by Resource Assignment report provides project managers a single place to view Actuals and ETC associated with resources across multiple Tasks and Projects. It displays the following: Actual and ETC Hours by Start Date: Stacked Column chart that displays the total Actual hours and ETC hours per month of fiscal period. Grey color indicates Actuals and Purple indicates ETC hours during that month. Grid: Displays Investment name, Task, Assigned resource ETC and Actual hours per month of fiscal period. It also displays aggregated column and row totals for Actuals and ETC hours. You can further narrow your search by OBS Type, OBS Path & Start Date range.
 -
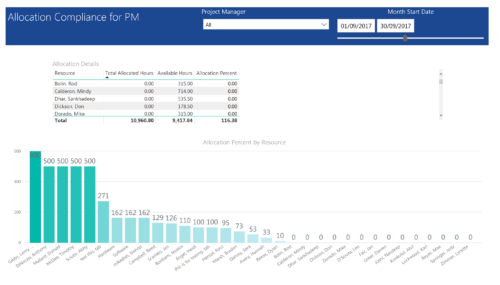 Allocation Compliance by PM report provides project managers a single place to view Available hours, Allocation Hours and Allocation Percentage of Investment Team Resources. It considers the investments of selected project manager and it displays the following: Allocation Details Grid: Displays Resource and its Allocated hours, Available hours and Allocation percentage (Allocated hours/Available Hours) Allocation Percent by Resource: Column chart that displays Allocation Percentage for various resources during the selected Time frame. You can further narrow your search by Project Manager & Month Start Date range.
 -
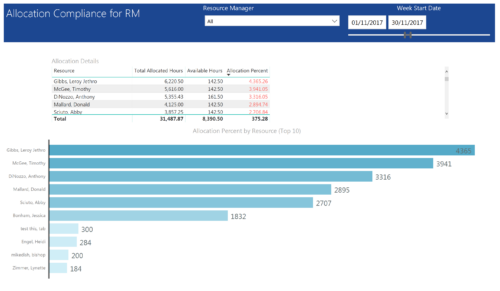 Allocation Compliance by RM report provides resource managers a single place to view Available hours, Allocation Hours and Allocation Percentage of Resources. It considers the resources of selected resource manager and it displays the following: Allocation Details Grid: Displays Resource and its Allocated hours, Available hours and Allocation percentage (Allocated hours/Available Hours) Allocation Percent by Resource: Bar chart that displays Allocation Percentage (top 10) for various resources during the selected Time frame. You can further narrow your search by Resource Manager & Month Start Date range.
 -
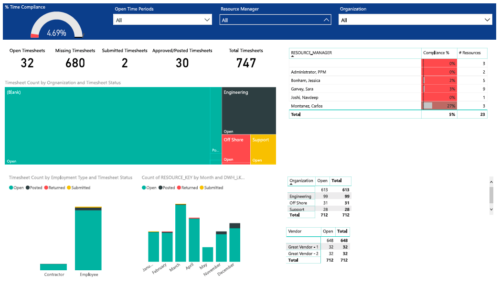 Timesheet compliance is a dashboard containing multiple visualizations that shows timesheet compliance data under various scenarios. Dashboard shows count of timesheets grouped by Status and total available timesheets. % Time Compliance – Gauge graph that shows percentage of completed timesheets against overall timesheets. Compliance by Resource Manager – Grid section that shows percent timesheet compliance by resource manager. Timesheet count by Employment type and Timesheet Status – Stacked column chart, each column represents Employment type and sections of the column represent count of timesheets by Status. Count of Timesheets by Months – Stacked column chart, each column represents a month and sections of the column represent count of timesheets by Status. Dashboard also const of two grid sections displaying number of Open timesheets by Organization and Vendor.
 -
 This video covers the process of accessing timesheets within Clarity, both as a team member and as a Project or Resource Manager.
 -
 This video covers the process of adding tasks to the timesheet using Populate and Add Task, using the timesheet notes functionality, entering timesheet data, updating ETC via the timesheet, and submitting the timesheet.
 -
 This video reviews how to return and approve Clarity timesheets as a Project or Resource Manager.


Copyright 2023 • Rego Consulting Corporation • Privacy Policy