-
 This training document is a Rego Consulting Quick Reference Guide to assist with creating and management of a project team in Clarity’s Modern User Experience. The document reviews accessing teams, creating a team, allocating a team on an investment, as well as additional team related information.
 -
 This session will align you with best practices for using Clarity's resource management functionality. Come and learn about the OOTB capabilities for resource insights like allocations, assignments, availability, and more. Additionally, tips and tricks will be shared, providing you with a toolkit of ideas for your organization!
 -
 This training document is a Rego Consulting Quick Reference Guide to assist with resource staffing in Clarity’s Modern User Experience. The document reviews accessing Staffing from the main menu, the Staffing Grid, and the Allocations Timeline.
 -
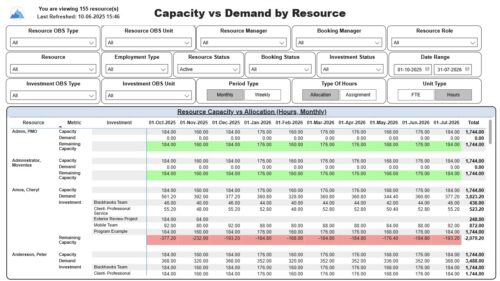 The Capacity vs. Demand by Resource report displays resource capacity and demand at the resource level across investments. The report gives you visibility into the capacity, demand, and remaining capacity by resource. The report displays amounts by week or month, and in total. The amounts might be displayed as hours or FTEs. Report Prerequisites: Verify that you have completed the following prerequisites before you run this report: • The Load Data Warehouse job must be run before you run this report. If the Data Warehouse is not populated, the report will not display any data. Also, most of the report parameters do not display options. • Resource demand allocation amounts display if the resource is allocated to at least one investment and the report display type of hours as allocations. Resource demand assignment amounts display if the resource is assigned to at least one task on the investment and the report displays type of hours as assignments.
 -
 To effectively practice Agile at scale, Clarity teams first need to identify various needs. This includes thinking through considerations for funding, investment prioritization, and spend management practices.
 -
 This training document is a Rego Consulting Quick Reference Guide to assist with the Resources Workspace in Clarity’s Modern User Experience. This doc references version 16.2.1 views. Document reviews the Resources, Roles and Teams tabs in the Resources Workspace.
 -
 This training document is a Rego Consulting Quick Reference Guide to assist with General Navigation in Clarity’s Modern User Experience. This doc references version 16.1.2 views. Doc reviews the Menu Bar and User Tool Bar.
 -
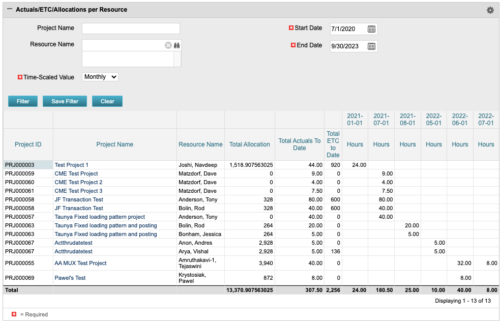 The portlet displays posted time by project for the logged in user based on time period and date range. This allows the user to see at a glance their ETC and actuals on the projects. The portlet displays the Total Allocation and Total Actuals to Date for the user on the projects they are allocated/assigned to. The actuals are displayed per month in the form of TSVs.
 -
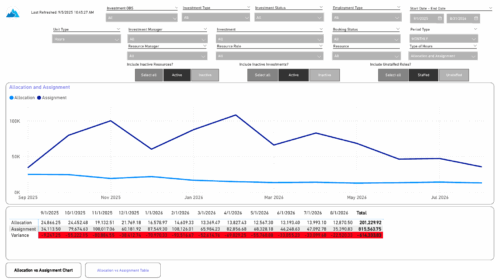 The Investment Allocations and Assignments report provides visibility into team member allocation, task assignment, and variance amounts by investment across time periods. A chart highlights allocation compared to assignment amounts by period. Results can be displayed by week, month, or in total, and viewed in either hours or FTEs for each team member and investment. Interactive visuals make it easy to compare planned effort against actual assignments at the team member and investment level. Content Type: Business Intelligence, PowerBI Report
 -
 This training document is a Rego Consulting Quick Reference Guide to assist with the adding of resources to the Staff tab for Ideas in Clarity’s Modern User Experience. This doc references version 16.3 views. Document provides detail on how to add resources to the Staff tab, Default Allocation % and Per-Period metrics.
 -
 This training document is a Rego Consulting Quick Reference Guide to assist with General Navigation in Clarity’s Modern User Experience. This doc references version 16.2.1 views. Doc reviews the Menu Bar and User Tool Bar.
 -
 This training document is a Rego Consulting Quick Reference Guide to assist with Allocations Timeline in Clarity’s Modern User Experience. This doc reviews the Investment Timeline and the Resource Histogram sections of the Allocations Timeline.


Copyright 2023 • Rego Consulting Corporation • Privacy Policy