-
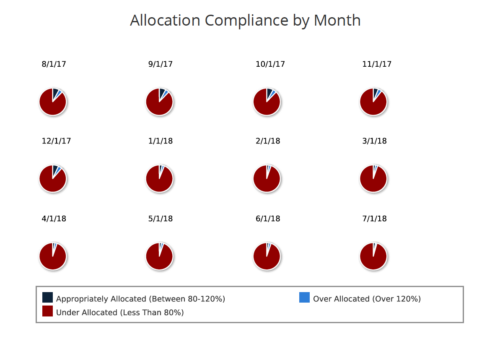 Allocation Compliance Pie Chart provides the resource manager a single place to view the Monthly Resource Allocation compliance for all resources in the form of a Pie chart. A separate Pie chart is displayed for each month. Allocation Compliance is calculated based on the value of 'Availability to Allocation Hours %'. Allocation Compliance is 'Under Allocated (Less Than 80%)' WHEN 'Availability to Allocation Hours %’ is less than 80. Allocation Compliance is 'Appropriately Allocated (Between 80-120%)' WHEN 'Availability to Allocation Hours %' is between 80 and 120. Allocation Compliance is 'Over Allocated (Over 120%)' WHEN 'Availability to Allocation Hours %' is greater than 120. User can further narrow their search by Resource Is Active? , OBS Type, OBS Path and Month Start Date. User can use exact dates or relative dates for Month Start Date filter parameter.
 -
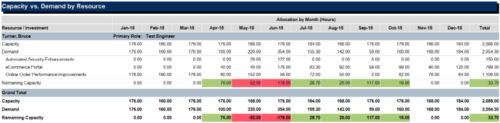
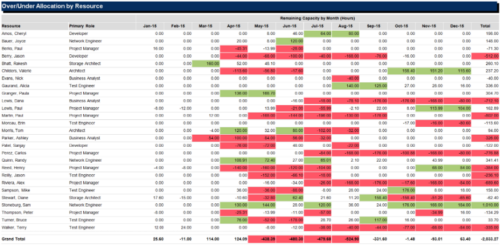 The Over/Under Allocation by Resource report is a transaction based Jaspersoft report that does not require the Load Jaspersoft Datawarehouse job to be run. The report will pull real-time data from the transaction tables in Clarity. This report can be run from either the Advanced Reporting or Reports and Jobs area within Clarity. The Over/Under Allocation by Resource report displays resource remaining capacity amounts by resource. The report displays amounts by week or month, and in total. The amounts can be displayed as hours or FTEs.
 -
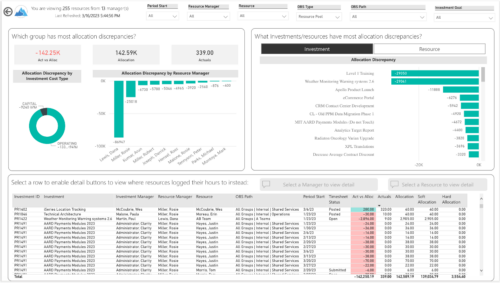
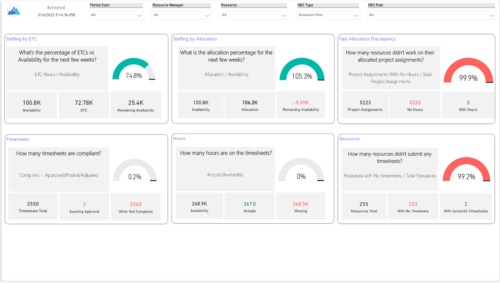 Evaluate resource allocations, identify bottlenecks, and ensure optimal resource utilization across projects and teams. Report Views include:
- Allocation Discrepancies
- Resource Detail
- Resource Skills
- Resource Summary
- Resource Tasks
- Staffing Allocations
- Staffing ETC
-
 The primary purpose of roles is to determine the amount of resource requests based on unapproved (uncommitted) and approved (committed) projects. Roles are non-named resources which are later allocated to named resources within CA PPM. Using roles is the best way to do "What If" scenario planning and determine needed capacity. This document assists in making Best Practice decisions around setting up roles in Clarity.
 -
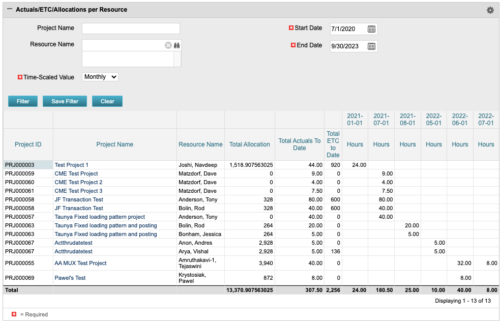 The portlet displays posted time by project for the logged in user based on time period and date range. This allows the user to see at a glance their ETC and actuals on the projects. The portlet displays the Total Allocation and Total Actuals to Date for the user on the projects they are allocated/assigned to. The actuals are displayed per month in the form of TSVs.
 -
The portlet displays posted time by project for the logged in user based on time period and date range. This allows the user to see at a glance their ETC and actuals on the projects. The portlet displays the Total Allocation and Total Actuals to Date for the user on the projects they are allocated/assigned to. The actuals are displayed per month in the form of TSVs.
-
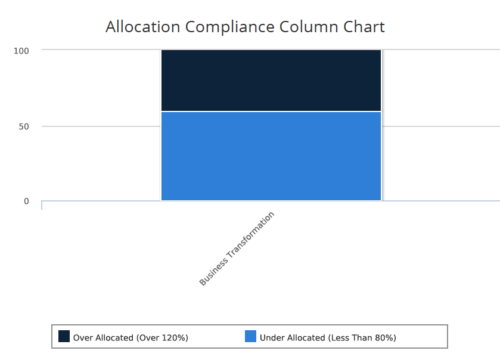 Allocation Compliance Column Chart provides the resource manager a single place to view the Allocation compliance information in the form of a stacked column chart. Allocation Compliance is calculated based on the value of 'Availability to Allocation Hours %'. Allocation Compliance is 'Under Allocated (Less Than 80%)' WHEN 'Availability to Allocation Hours %’ is less than 80. Allocation Compliance is 'Appropriately Allocated (Between 80-120%)' WHEN 'Availability to Allocation Hours %' is between 80 and 120. Allocation Compliance is 'Over Allocated (Over 120%)' WHEN 'Availability to Allocation Hours %' is greater than 120. User can further narrow their search by Resource Is Active?, OBS Type & Path, Associated Project OBS?, Allocation Start Date, Investment Name and Resource Manager. User can use exact dates or relative dates for Allocation Start Date filter parameter.
 -
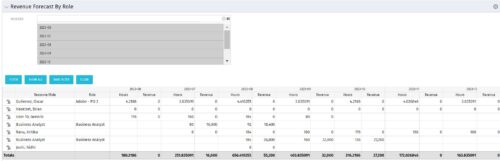 The Revenue Forecast by Role portlet displays forecasted revenue by both resource and role on the given project, broken out by month. The table below describes the available filter fields in the portlet.
Column Label Description Months Fiscal months to display -
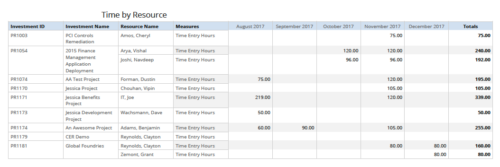 Time by resource is a grid report that provides resource and project managers a single place to view time logged to projects by resource over a period of time. This report provides information such as Investment ID, Investment Name, Resource Name and Time Logged Hours on period basis. Report provides you the flexibility of changing period type to Year, Quarter, Month and Day. You can further narrow your search by OBS Type & Path, Resource Name, Investment Name, Period Start Date and Is Investment Active?
 -
 Without good data, your digital transformation won’t succeed. This session talks about generating and understanding value stream metrics, including how investments and teams are performing.
 -
 Traditional project management isn’t dead, but it is heavily influenced by Agile teams and thinking. This course looks at ways you can help bring together disparate delivery units across the enterprise.


Copyright 2023 • Rego Consulting Corporation • Privacy Policy