-
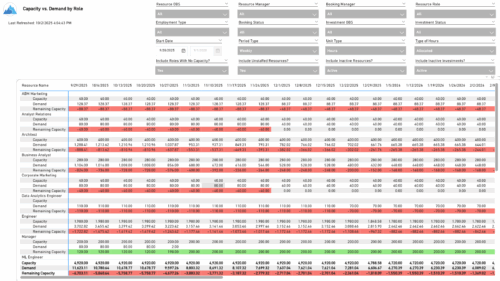 The Capacity vs. Demand by Role report provides visibility into resource utilization by comparing available capacity to actual demand across investments at the role level. It highlights capacity, demand, and remaining capacity, helping identify potential surpluses or shortfalls. Data can be viewed by week or month and displayed in either hours or full-time equivalents (FTEs) to support detailed workforce planning and analysis.
 -

 A presentation slide deck from Rego University 2022. Presentations by Erie Insurance, University of California, San Francisco, and The Hershey Company.
 -
 Course Description: This class will provide a list of daily and weekly activities that every resource manager should follow to leverage Clarity PPM more effectively.
 -
 Do you want to add interfaces to your CA PPM instance? This class will review the pros and cons of various integration methods and provide best practice on how to handle various interfaces. We’ll walk you through specific interface examples and showcase Rego’s pre-built interface sets you can leverage to reduce the time and cost of implementation.
 -
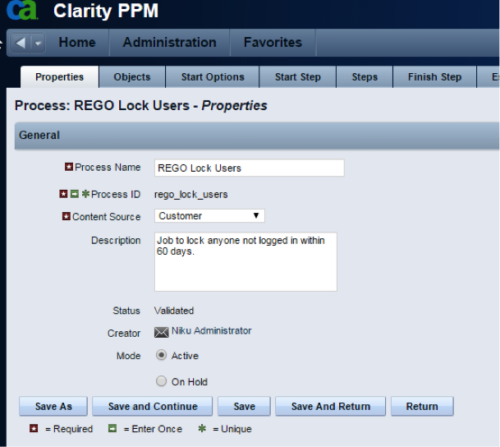 The Lock Inactive Users workflow process will automatically lock all user accounts when their last login date was more than 60 days ago. The process can be scheduled to run daily or can be run on demand when resource account cleanup is needed.
 -
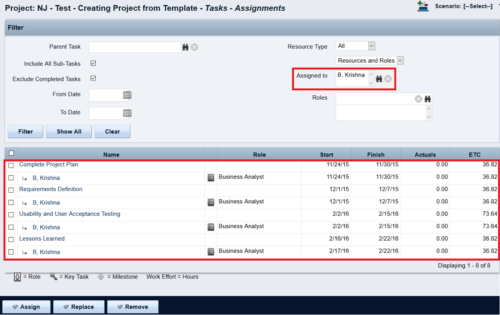
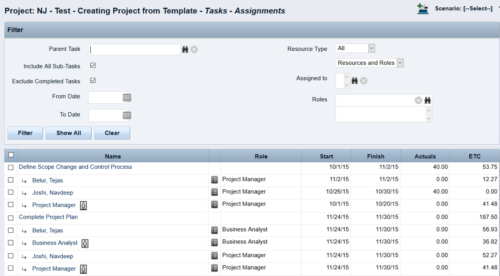 This Tech Trick walks you through the steps in CA PPM to make Bulk Role replacements on tasks. Useful when you want to make the changes to the project template which has a large WBS structure, and a lot of role assignments to tasks.
 -
 The Resource Management training document provides an in-depth guide to resource management. This presentation is designed to provide resource managers with an overview to managing time, inputting users and roles, adjust allocations, availability and more within Clarity’s resource management module. This guide provides step-by-step instructions as well as detailed screenshots to ensure that the learning curve for your resource managers is minimal.
 -
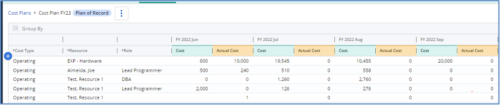
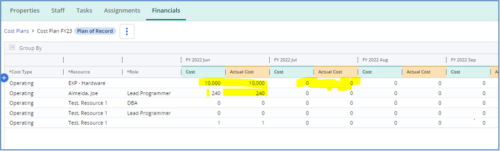 The Populate Prior Periods Forecast From Actuals in Cost Plans process updates Cost Plans for Active Projects, it updates the Forecast for previous months = Posted Actuals, to remove variances from past periods. This is an On Demand process in Clarity named Populate Prior Periods Forecast From Actuals in Cost Plans and can be manually executed from the Organizer or scheduled through the “Execute a Process” job. If there are number of processes in the Organizer – Available Processes, this process can be filtered and then checked to Start. When the process is started it will be seen in the Initiated on the Processes tab. The process status can be monitored from Running to the Completed stage. The process is very flexible and supports Cost Plans with any given grouping and it also works without any dependency on timeslices or other jobs. The process fetches Cost plan of records for all active projects in the system that have Actuals transactions in WIP table. It then process those cost plans to update all of the prior monthly forecast periods with the corresponding monthly Actuals.
 -
 This training document is a Rego Consulting Quick Reference Guide to assist with Staff Grid in Clarity’s Modern User Experience. This doc references version 16.2.1 views. Document provides detail on the use of the Staff Grid in the Staffing Modules in the Common Component functionality.
 -
 A presentation slide deck from RegoU 2024. This course focused on an itDesign product that adds-on to Clarity for Resource Management enhancement.
 -
 You can’t wait, integrate! Clarity is highly capable of being the center of a hub and spoke ecosystem for your project delivery. With flexible integration options and robust portfolio reporting and decision support functionality, Clarity will help you consolidate data from multiple systems of record into one source of truth. Join this class to see common use cases for optimizing a PPM delivery value stream that cuts across a diverse suite of applications, including HR, Finance, ITSM, Agile, Work Management, and many more.
 -
 The Rego PowerBI Reporting Suite features close to 100 free PowerBI reports, designed to enhance project management and reporting capabilities.


Copyright 2023 • Rego Consulting Corporation • Privacy Policy