-
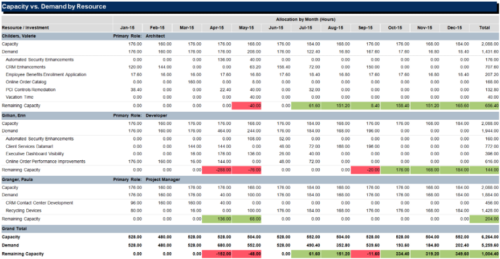 The Capacity vs Demand by Resource report is a transaction based Jaspersoft report that does not require the Load Jaspersoft Datawarehouse job to be run. The report will pull real-time data from the transaction tables in Clarity. This report can be run from either the Advanced Reporting or Reports and Jobs area within Clarity. The Capacity vs. Demand by Resource report displays resource capacity and demand at the resource level across investments. The report gives you visibility into the capacity, demand, and remaining capacity by resource. The report displays amounts by week or month, and in total. The amounts might be displayed as hours or FTEs.
 -
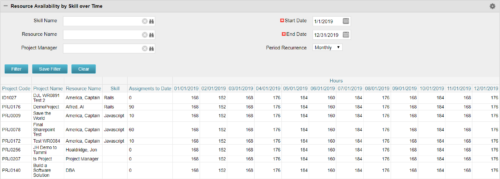 Resource Availability by Skill over Time is a grid portlet that provides Resource Managers a single place to view Resources’ skill sets along with their availability (hrs.) over a period of time. This report also displays the assigned Investments to date and the Actual hours to date for the Resource on those respective Investments. Users can further narrow their search by Skill Name, Resource Name, Project Manager, Start Date, End Date and Period Recurrence.
 -
Resource Availability by Skill over Time is a grid portlet that provides Resource Managers a single place to view Resources’ skill sets along with their availability (hrs.) over a period of time. This report also displays the assigned Investments to date and the Actual hours to date for the Resource on those respective Investments. Users can further narrow their search by Skill Name, Resource Name, Project Manager, Start Date, End Date and Period Recurrence.
-

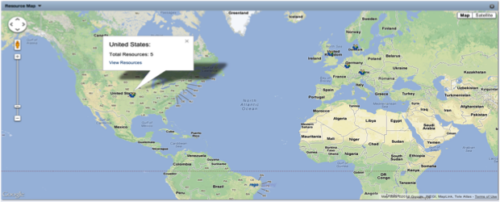 The Resource Map portlet is designed to display resource counts, by country, on a map of the world. Clicking one of the resource markers on the map will display the total resource count for that country. Additionally, a link is provided that connects to a grid portlet which displays all resources that reside in that country. The ability to zoom in and out on areas of the world is available. Due to the requirements outlined in the Special Installation Instructions section, this portlet requires 2-3 Rego Consulting hours to install. Further customization of the data on this map and its associated grid portlet may be requested. Please contact us for more details.
 -
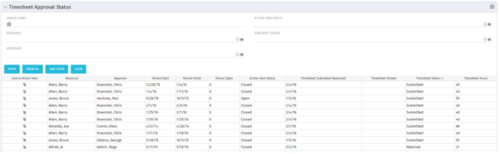 Portlet to show the stage of any Action Item triggered by Timesheet submission. Portlet allows for a period start date input, filters by Resource, Approver, Action Item Status and Timesheet Status. A link to the action item is provided for direct action by review if needed. This portlet is only for the clients who have established a process that triggers on Timesheet Status change to Submitted and to send Action Items to the person responsible for timesheet approval/validation i.e. PM for project tracking and/or RM for overall approval of the timesheet. The portlet won’t display any data if there are no timesheet Action Items. Examples of such processes would be CA’s OOTB Project Manager Approval or the Timesheet Approval - PM and RM process found on RegoXchange.
 -
Portlet to show the stage of any Action Item triggered by Timesheet submission. Portlet allows for a period start date input, filters by Resource, Approver, Action Item Status and Timesheet Status. A link to the action item is provided for direct action by review if needed. This portlet is only for the clients who have established a process that triggers on Timesheet Status change to Submitted and to send Action Items to the person responsible for timesheet approval/validation i.e. PM for project tracking and/or RM for overall approval of the timesheet. The portlet won’t display any data if there are no timesheet Action Items. Examples of such processes would be CA’s OOTB Project Manager Approval or the Timesheet Approval - PM and RM process found on RegoXchange.
-
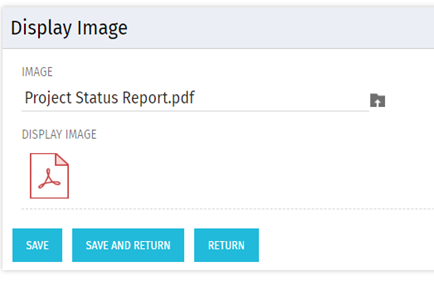 There are many times user’s wants to see the preview of file uploaded on attachment attribute. This Technical Trick will illustrate the steps for an Administrator to preview an attachment. This solution will help to preview PDF, Text file and Image(.png) file. For Microsoft word, PowerPoint and Microsoft Excel, it displays an icon.
 -
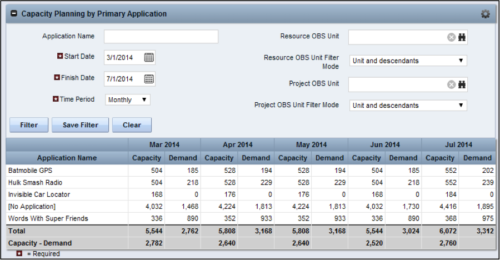 The Capacity Planning by Primary Application portlet displays the capacity and demand by primary application for a selected timeframe. This portlet is used to determine which applications are in high demand, being used efficiently, and how much capacity may be remaining for the time period. The portlet may be filtered by application name, resource OBS or project OBS to narrow the results. The timeframe can be set to display daily, weekly, monthly, quarterly, or annually.
 -
The Capacity Planning by Primary Application portlet displays the capacity and demand by primary application for a selected timeframe. This portlet is used to determine which applications are in high demand, being used efficiently, and how much capacity may be remaining for the time period. The portlet may be filtered by application name, resource OBS or project OBS to narrow the results. The timeframe can be set to display daily, weekly, monthly, quarterly, or annually.
-
The Capacity Planning by Primary Application portlet displays the capacity and demand by primary application for a selected timeframe. This portlet is used to determine which applications are in high demand, being used efficiently, and how much capacity may be remaining for the time period. The portlet may be filtered by application name, resource OBS or project OBS to narrow the results. The timeframe can be set to display daily, weekly, monthly, quarterly, or annually.


Copyright 2023 • Rego Consulting Corporation • Privacy Policy