-

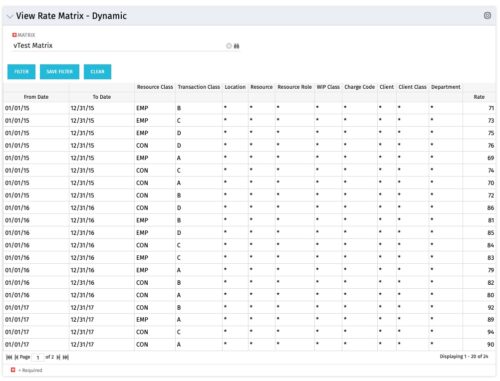 View Rate Matrix is a grid portlet that provides users a single place to view all the rates defined across multiple rate matrix without going to administration tab. Each Matrix may be defined with different columns (ex: Charge Code, Client, Department, Entity, Input type Code etc). This portlet dynamically brings only the columns associated with that rate matrix and provides the detailed information. User can view information related to one matrix at a time.
 -
 The Dashboard: Project Status Single-line portlet gives an overview of the project overall status as well as the status indicators on the "current" status report object. The portlet will pull the "id" from the page it is placed on, so this portlet is usually placed on the project dashboard tab. This portlet displays the report date, symbols relating to the overall status, scope, schedule, cost/effort, and the overall explanation across a single line in the portlet.
 -
 This training document is a Rego Consulting Quick Reference Guide to assist with creation and management of resource Teams in Clarity’s Modern User Experience. This doc references version 16.1 views. Document provides detail on how to create Teams and add resources to a Team. Instructions are provided on how to add resources by OBS and how to allocate a team to an investment. Team key points are provided with regard to Classic, Allocations, ETC and Financials.
 -
 This portlet displays the actual hours resources entered against investments. The per-period actual hours can be showed in days, weeks, months, quarters, or years. The data can be filtered by Resource, Resource Manager, OBS Unit, Investment and time period
 -
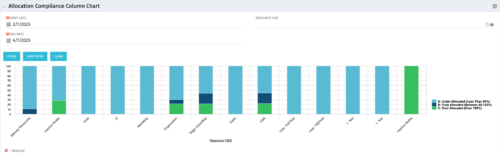 This view depicts Allocation Compliance for resources grouped by OBS. Using the daily Resource Availability and Daily Resource Allocation Time Slices this column chart groups aggregate Allocation vs Availability by OBS Unit. The chart allows quick analysis to see if resources are adequately allocated (between 80% to 120% of their capacity) or if they are significantly under or over allocated. NOTE: The grouping of OBS unit is limited to 1 level below the selected OBS in the portlet filter.
 -
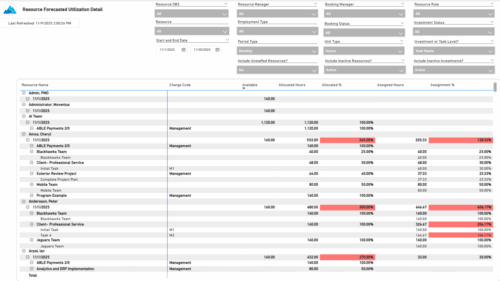 The Resource Forecasted Utilization Detail report provides a detailed view of resource utilization by showing availability, allocation, and assignment values at both the investment and task level. The report is grouped by resource and time period, with data displayed weekly or monthly, as well as in total. Values can be shown in hours or full-time equivalents (FTEs), supporting detailed analysis of workload and forecasted demand.
 -
 Do you want to talk to other customers that are using or plan to use demand management? In this moderated Round Table where customers can share experiences and provide insights on process, configurations, challenges, and successes. We will have an expert panel and then divide into small groups and discuss customer selected topics - 100% sharing.
 -
 Without good data, your digital transformation won’t succeed. This session talks about generating and understanding value stream metrics, including how investments and teams are performing.
 -
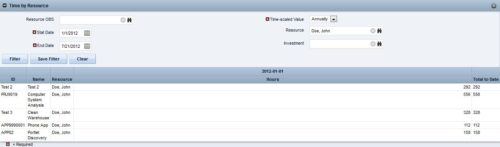
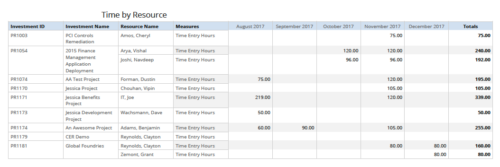 Time by resource is a grid report that provides resource and project managers a single place to view time logged to projects by resource over a period of time. This report provides information such as Investment ID, Investment Name, Resource Name and Time Logged Hours on period basis. Report provides you the flexibility of changing period type to Year, Quarter, Month and Day. You can further narrow your search by OBS Type & Path, Resource Name, Investment Name, Period Start Date and Is Investment Active?
 -
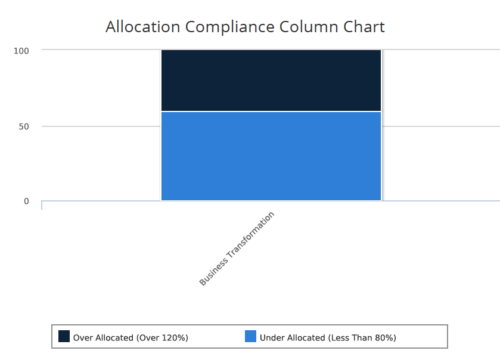 Allocation Compliance Column Chart provides the resource manager a single place to view the Allocation compliance information in the form of a stacked column chart. Allocation Compliance is calculated based on the value of 'Availability to Allocation Hours %'. Allocation Compliance is 'Under Allocated (Less Than 80%)' WHEN 'Availability to Allocation Hours %’ is less than 80. Allocation Compliance is 'Appropriately Allocated (Between 80-120%)' WHEN 'Availability to Allocation Hours %' is between 80 and 120. Allocation Compliance is 'Over Allocated (Over 120%)' WHEN 'Availability to Allocation Hours %' is greater than 120. User can further narrow their search by Resource Is Active?, OBS Type & Path, Associated Project OBS?, Allocation Start Date, Investment Name and Resource Manager. User can use exact dates or relative dates for Allocation Start Date filter parameter.
 -
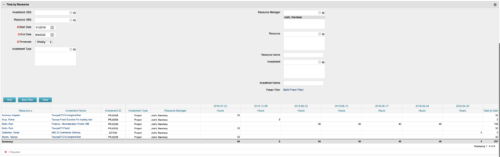
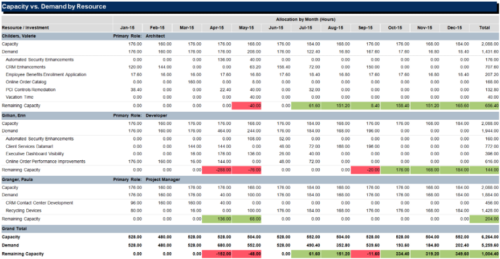 The Capacity vs Demand by Resource report is a transaction based Jaspersoft report that does not require the Load Jaspersoft Datawarehouse job to be run. The report will pull real-time data from the transaction tables in Clarity. This report can be run from either the Advanced Reporting or Reports and Jobs area within Clarity. The Capacity vs. Demand by Resource report displays resource capacity and demand at the resource level across investments. The report gives you visibility into the capacity, demand, and remaining capacity by resource. The report displays amounts by week or month, and in total. The amounts might be displayed as hours or FTEs.
 -
 This training document is a Rego Consulting Quick Reference Guide to assist with utilization of the Staffing page in Clarity’s Modern User Experience. This doc references version 16.0.3 views. Document provides detail on the layout and capabilities of the Staff Grid as well as the Allocations Timeline. Information is provided on columns, widgets and filtering. Instructions are provided on how to save Views. Summary information is provided on the layout of the Allocation Timeline and includes detail on the Investment Timeline and the Resource Histogram. Investment Timeline summary contains information on the Allocations by Investments and the Allocations by Resources tabs. While the Resource Histogram section provides screenshots on Resource Availability and Resources by Role.


Copyright 2023 • Rego Consulting Corporation • Privacy Policy