-
 Finding the right project manager can be tricky. How do you know which candidates have the appropriate leadership, forecasting, and problem-solving skills? Interviewing strategies can make all the difference. This paper discusses important ways you can prepare for a project manager interview. It points out hazards to sidestep and best practices for identifying candidates with the right proficiency. This White Paper is downloaded from the Rego Consulting site. You will be asked to provide your email address and current ppm tool. - http://info.regoconsulting.com/how-to-hire-the-right-pm ** No Download - Do not Add to Cart **
 -
 Resource Management - Are You Doing it Right? Companies of all shapes and sizes need to know if they have the right people working on the right things at the right time, to meet their objectives. Rego's own Grant Zemont has put together this report to help your company learn the best practices for setting up a resource management office correctly. Download the free report here. This White Paper is downloaded from the Rego Consulting site. You will be asked to provide your email address and current ppm tool. - http://info.regoconsulting.com/rmo-report ** Do not Add to Cart - No Downloadable File**
 -
 ** No Download - Do not Add to Cart** - Register for the White Paper at this link - http://info.regoconsulting.com/create-rmo-that-works-2020 Is your organization struggling to make sure you have the right people working on the right initiatives to meet your objectives? If so, you’re not alone. In this white paper, Rego’s Grant Zemont provides insight on what your company can do to create an RMO to get you pointed in the right direction for success.
 -
 Rego’s training video that walks through the Time Entry and Approval process for Clarity PPM – Modern User Experience. This video was created using Clarity PPM version 15.6.
 -
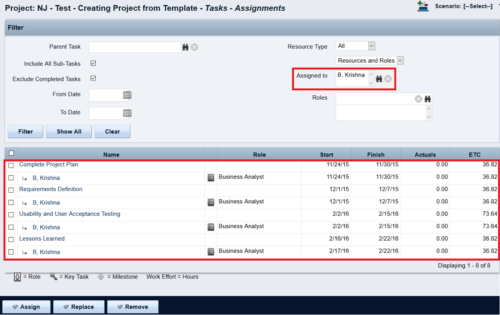
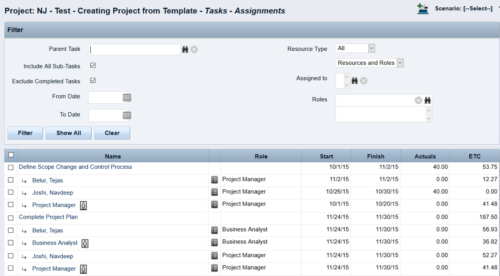 This Tech Trick walks you through the steps in CA PPM to make Bulk Role replacements on tasks. Useful when you want to make the changes to the project template which has a large WBS structure, and a lot of role assignments to tasks.
 -
 Many times Roles are spread out geographically or by function and these Roles will have different rates. For example, a developer in India may charge $25/hour vs a Developer in US may charge $50/hour. When the project team has a requirement of several developers, the PM will have to add a region specific role (Developer-US, Developer-India) so that the right rates can be applied when a cost plan is created. This creates a challenge in terms of Resource Management. As the Demand and Capacity can be spread between different region specific roles. Proper configuration on the Rate Matrix can allow you to have one Role name but different rates based on Location or Department. This allows greater flexibility and takes away the redundancy of Role Names. You can do so with the Project Team Member Properties.
 -
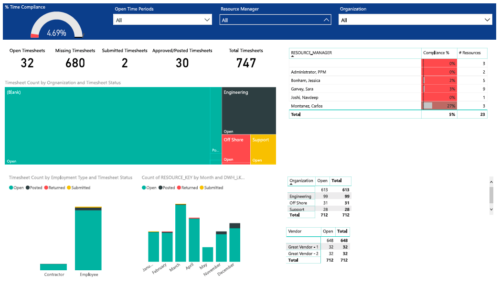 Timesheet compliance is a dashboard containing multiple visualizations that shows timesheet compliance data under various scenarios. Dashboard shows count of timesheets grouped by Status and total available timesheets. % Time Compliance – Gauge graph that shows percentage of completed timesheets against overall timesheets. Compliance by Resource Manager – Grid section that shows percent timesheet compliance by resource manager. Timesheet count by Employment type and Timesheet Status – Stacked column chart, each column represents Employment type and sections of the column represent count of timesheets by Status. Count of Timesheets by Months – Stacked column chart, each column represents a month and sections of the column represent count of timesheets by Status. Dashboard also const of two grid sections displaying number of Open timesheets by Organization and Vendor.
 -
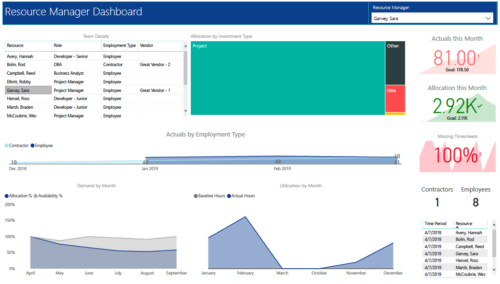 RM Dashboard shows various KPIs like Actuals posted by the resources in last month, Allocation in current month, count of missed timesheets etc. Team Details – Grid report providing list of all the resources managed by a resource manager. Allocation by Investment type – Tree graph displaying distribution pattern of allocation hours across different investment types. Actuals by Employment Type - Area graph, displaying actual hours posted by Employees Vs Contractors. Demand by Month – Area graph, displaying Allocation Vs Availability for next 6 months. Utilization by Month - Area graph, displaying Baseline Vs Actuals hours over last 6 months.
 -
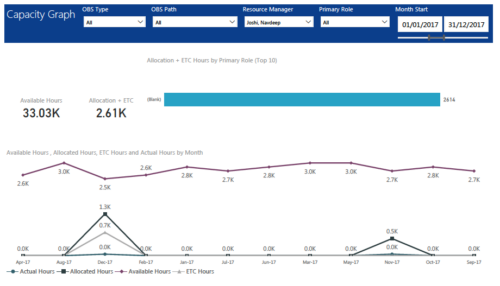 Capacity Graph report displays Availability, Allocations, Actuals and Assignments for one or more active resource(s) in a single view. Report contains the following components: KPIs: Displays Available hours, Allocation + ETC for filtered criteria. Bar graph: Displays Allocation + ETC by primary role Line chart: Displays Availability, Allocations, Actuals and Assignments by time period. This portlet provides Resource Managers, PMOs and Executives with a simple way to analyze: Allocations vs. Availability, Allocations vs. Actuals, Allocations vs. ETC and ETC vs. Availability. User can further narrow their search by OBS Type & Path, Resource Manager, Primary Role, Start and End Date.
 -
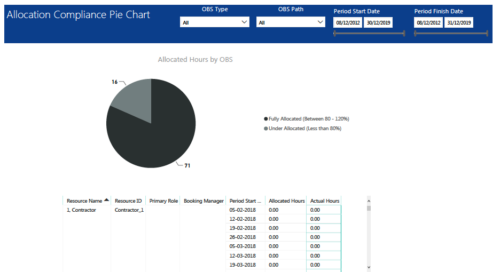 Allocation Compliance Pie Chart report provides resource managers a single place to view Allocation compliance for various resources. It displays the following: Allocated Hours by OBS chart: Pie chart that displays percentage of resources that are fully allocated (80 -120 %) and under allocated (less than 80%) for a particular OBS and selected period range. Grid: Displays Resource Name, Resource Id, Primary Role, Booking Manager, Period, Allocated hours and Actual hours during that period. You can further narrow your search by OBS Type, OBS Path & Period Date range.
 -
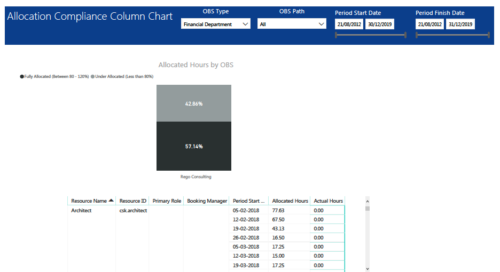 Allocation Compliance Column Chart report provides resource managers a single place to view Allocation compliance for various resources. It displays the following: Allocated Hours by OBS chart: Stacked Column chart that displays percentage of resources that are fully allocated (80 -120 %) and under allocated (less than 80%) for a particular OBS and selected period range. Grid: Displays Resource Name, Resource Id, Primary Role, Booking Manager, Period, Allocated hours and Actual hours during that period. You can further narrow your search by OBS Type, OBS Path & Period Start Date range.
 -
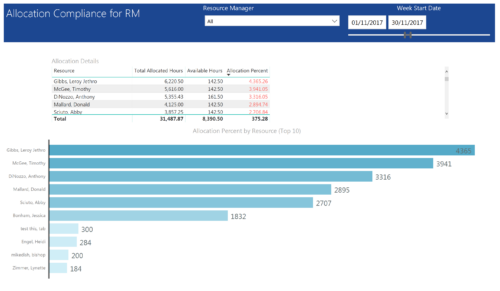 Allocation Compliance by RM report provides resource managers a single place to view Available hours, Allocation Hours and Allocation Percentage of Resources. It considers the resources of selected resource manager and it displays the following: Allocation Details Grid: Displays Resource and its Allocated hours, Available hours and Allocation percentage (Allocated hours/Available Hours) Allocation Percent by Resource: Bar chart that displays Allocation Percentage (top 10) for various resources during the selected Time frame. You can further narrow your search by Resource Manager & Month Start Date range.


Copyright 2023 • Rego Consulting Corporation • Privacy Policy