-
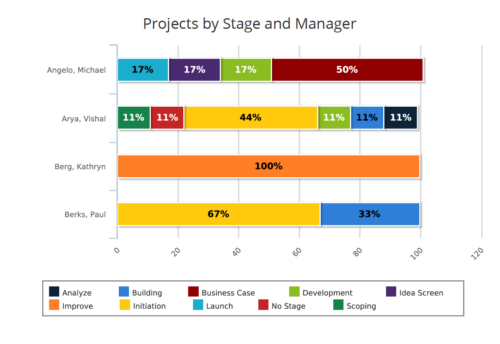 Projects by Stage and Manager report is a stacked bar chart that displays percentage of projects associated with project manager at a particular stage. Legend displays colors used to represent various Project Stages. This report provides to PMO a quick snapshot of where certain projects are sitting with each Project Manager. You can further narrow your search by Project Manager, Project Name, Is Project Active? , Is Template? And Is Program?
 -
 This portlet shows the project costs by Month. The information displayed includes:
- Start Date for project
- End Date for project
- Budgeted Cost
- Planned Cost
- Actual Hours
-
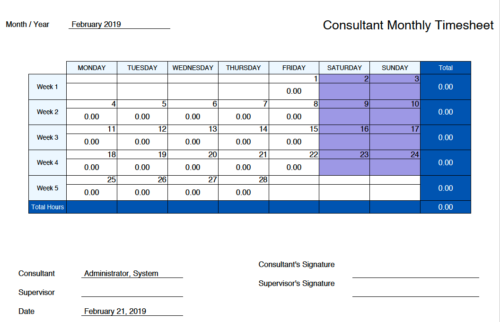 Monthly Actuals -User View is a standard calendar view of actuals posted by logged in user on each day of the selected month. Actuals also includes timesheets that haven’t been submitted/posted yet. Actual hours on the report are tied to user's availability i.e. when user has 0 availability (Saturday/Sunday/Holiday) then actuals are greyed out.
 -
 With only 15% of companies successfully transforming digitally, it’s time for the PMO to take charge. This session talks about how the PMO effectively can support the digital transformation within the enterprise by reimagine its traditional charter
 -
 Without good data, your digital transformation won’t succeed. This session talks about generating and understanding value stream metrics, including how investments and teams are performing.
 -
 This training document is a Rego Consulting Quick Reference Guide to assist with Idea approval and conversion to projects in Clarity’s Modern User Experience. This doc references version 16.2.1 views. Doc reviews setting Ideas as Approved and converting Ideas to projects.
 -
 The Project Risk Register report provides visibility into project risks, including detailed information on each risk and its associated items such as notes, action items, tasks, and related risks or issues. Results can be grouped by project or viewed without grouping to support flexible analysis. Interactive visuals make it easy to track, monitor, and manage risks across projects.
 -
 The need to report and organize work around the Products continues to grow. Join this session to hear how Project and Product Management can thrive together in Clarity.
 -
 Want to boost Clarity adoption and data quality, all while having fun and keeping users engaged? Learn how gamification can benefit your organization in this exclusive demo. Check out features that reward users for desired behaviors, enable personalization, and offer fun ways to track project health through the animated world of Planimals.
 -
 Aligning work to organizational strategy is a fundamental requirement in today's ever-changing marketplace. High performing organizations are moving beyond basic connections to introduce strategic hierarchies that are tied to real measurements of business value via Clarity's Objectives and Key Results (OKRs). Join our expert guides as they present key concepts, best practices, and the evolution of strategic alignment.
 -
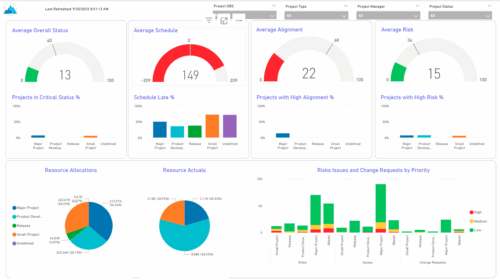 The KPIs by Project Type (Dashboard) report provides visibility into key project health measures, including status, schedule, alignment, and risk. Gauge visuals highlight each KPI at a summary level, while column charts break down results by project type. Resource allocation and actual hours are summarized in pie charts, making it easy to compare utilization across project types. In addition, bar charts display the number of issues, risks, and change requests by project type and priority, helping teams quickly identify areas of concern.
 -
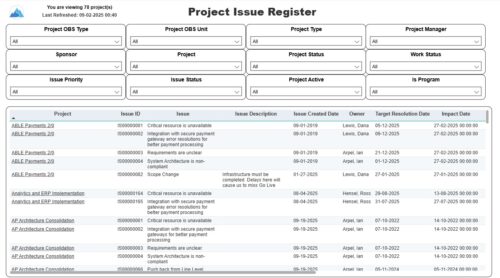 The Project Issue Register report displays comprehensive information for each project issue. The issue register also provides the option to display items that are associated to the issue such as notes, action items, and tasks. Report Prerequisites Verify that you have completed the following prerequisites before you run this report: • The project must have at least one issue for the project to display in the report. • The issue properties must have fields such as description, category, resolution, target resolution, impact date, and originating ID completed for them to display data in the report. The issue name, issue ID, priority, status, and owner are required in Classic PPM so they always display data.


Copyright 2023 • Rego Consulting Corporation • Privacy Policy